On May 3, we highlighted a bullish breakout for the stock/bond ratio, which implied higher stock and lower bond prices.
Since then, 30-year Treasury prices have suffered the worst decline in quite a while. What’s next for long-term Treasury prices?
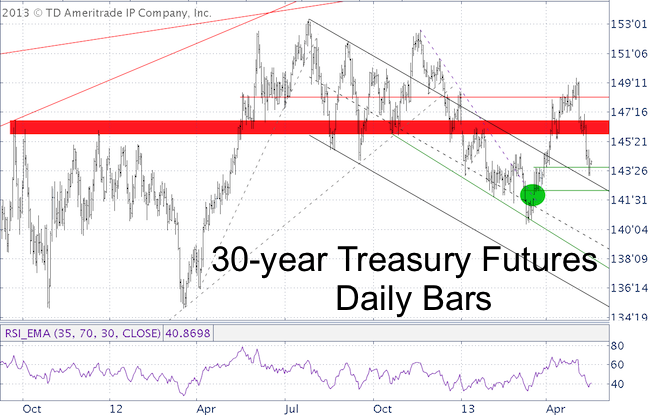
Chart #1 shows the performance of 30-year Treasury futures, the purest representation of 30-year Treasury prices.

Prices have broken through two important support levels/ranges (red line, bar), which has taken all the steam out of the up trend.
There are some support levels near current prices. This should cause a recognition bounce, but lower prices seem likely. RSI is closer to a new low than Treasury prices, which suggests that selling is broad based.
Things looked more promising two months ago at the bullish breakout (green circle). On March 17, the Profit Radar Report wrote that: “With prices back above trend line resistance the move may be strong enough to lead to higher prices. A small pullback to about 142.18 would provide a lower-risk entry point compared to chasing prices.” The pullback to 142.18 occurred the next day.
The April 28, Profit Radar Report warned that a close below 147.18 “would be the first red flag.” Even more, it was the beginning of the end, at least for the previous rally.
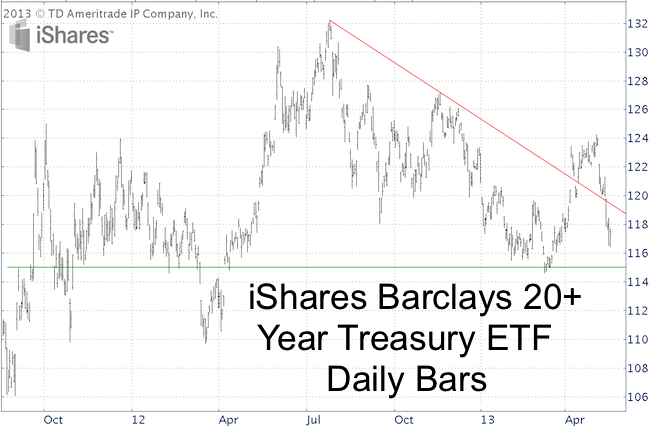
The chart of the iShares Barclays 20+ Year Treasury ETF (TLT) looks slightly different, but sings the same song of worry. Chart #2 shows TLT hovering aimlessly between support and resistance.

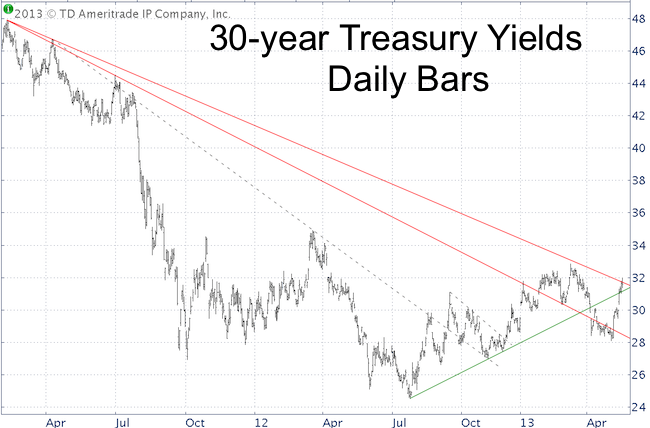
As Treasury prices decline, yields rise (and vice versa). This inverse relationship makes it interesting to also take a look at 30-year Treasury yields, illustrated by chart #3.
Yields are sandwiched right between red trend line resistance and green trend line support. Yields have not yet broken above long-term trend line resistance. A close above 3.16% is needed to confirm the breakdown in prices.
Summary: Long-term Treasuries are likely to see lower prices, but I would wait for confirmation in the form of a bullish yield breakout.
The ETF SPY provides FREE weekly trade set ups. >> Sign up for the free newsletter to get future ETF SPY ideas.

|