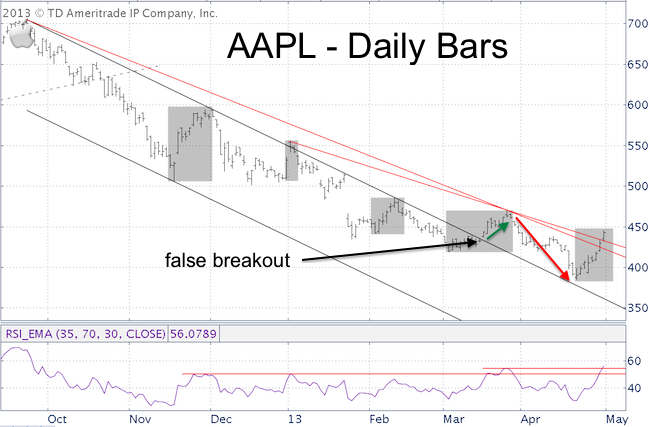
September 21, 2012: AAPL rallies to all-time high of 705.
April 14, 2013: AAPL falls as low as 385.
From high to low AAPL loses as much as 45%. During that time, AAPL rallies more than 10% four times. Since its April low, AAPL again is up 15%.
Is this rally here to stay or will Apple relapse again?
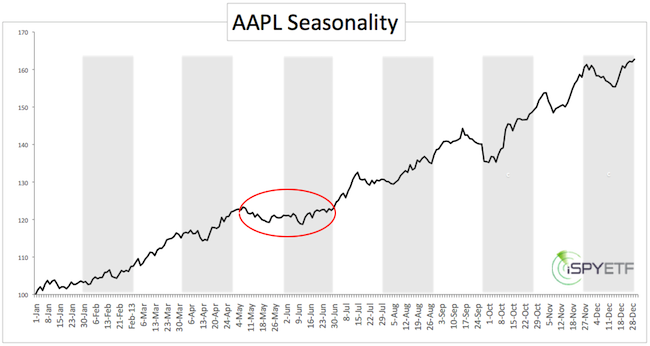
AAPL Seasonality
Apple has enjoyed a 10+ year bull market and the consistently rising prices are reflected in Apple’s seasonality chart.
Apple shares suffered larger drawdowns in May 2010 and May 2012, which contribute to the seasonal May/June lull expressed by the chart below.
Based on seasonality, May is not a great time to be long Apple in particular or stocks in general.

AAPL Technicals
Apple’s ‘technical health’ appears better today than at any other time since last year’s high. This week’s rally pushed prices above double trend line resistance as well as the 20-and 50-day SMA’s. RSI is also at a 7-month high.
This is bullish price action, but there are two flies in the ointment:
1) Prices pushed above parallel channel resistance and the 20-and 50-day SMA just before embarking on the next leg down.
2) Apple seasonality is less than bullish for May/June.
Summary
Price broke above trend line resistance. Generally that’s bullish, but a previous breakout turned into a fake out.
We’ve been out of Apple for a while. The September 12, 2012 Profit Radar Report advised that: “Aggressive investors may short Apple (or buy puts or sell calls) above 700 or with a close below 660.”
Apple around 440 is certainly more attractive than AAPL around 700 and if Apple is on your stock ‘bucket list,’ now might be an opportune time to deploy some (not ‘all’ or ‘most’ of your) money. There was no bullish RSI divergence at the recent low. This cautions that the decline is not yet finished. The red trend lines should be used as a stop-loss level.

|