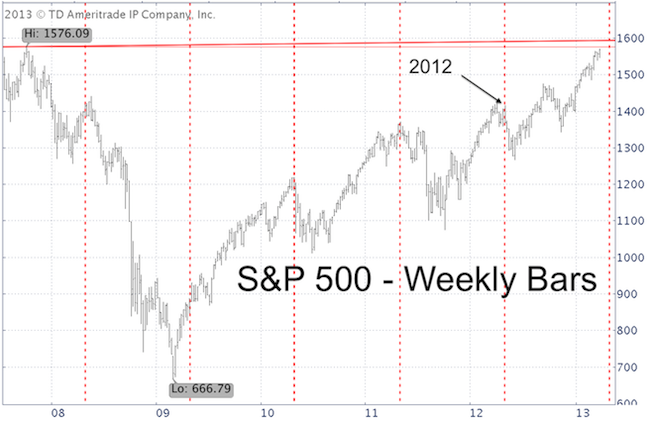
When you look at the first chart you’ll inevitably say: “Why didn’t I think of that?” Sell in May and go away worked for five years in a row. But when it’s too obvious, it must be wrong, right? Here are the S&P 500 trigger levels that suggest May weakness arrived early this year.
Below is an excerpt of the Profit Radar Report forecast for the month of April/May. It includes detailed analysis of the bearish April/May seasonality.
“Forecast for the month ahead: Investors Business Daily just inquired about my 2nd quarter ETF pick. I expect the 2nd quarter to be a tale of two markets, so coming up with one pick was a tough assignment. Click here to read the Investors Business Daily write up.
Why a tale of two markets? The chart below highlights a pattern that played out in 2008, 2010, 2011 and 2012. The S&P 500 sprinted into an April/May high and collapsed thereafter.

The table below captures more pattern details, such as the May 1 (or closest trading day) high, Q2 high, subsequent low and the May 1 to subsequent low loss.

Unfortunately, I’m not the only one to pick up on this pattern. The ‘sell in May and go away’ phrase is already making its rounds. Anytime a certain pattern or reaction is too widely recognized, there’s reason to be suspicious. I’m not suspicious enough to disregard the pattern, but we will use trigger levels to identify low-risk entry levels.
Here are two character traits that may help us authenticate the developing pattern:
1) The May high usually occurs quickly. There’s a spike higher followed by a quick decline. A slow top (several consecutive dojis) or failure to decline would caution that the pattern will delay or not show.
2) A deep retracement following the initial top and decline may form a double top. We saw this in 2012 (see first chart) and I wouldn’t be surprised to see a mid-April high followed by a secondary May high.
The upcoming Profit Radar Reports will deal with any possible changes to the pattern, but for now we expect stocks to maintain a bid for at least the first week of April and rally deeper into the resistance range/target at 1,576 – 1,593 (red lines on chart).
Since the market has blown past previous resistance areas, we will wait for one of the following triggers before going short:
1) A move above 1,577 followed by a close below 1,576.
2) A move to 1,590 (stop-loss around 1,610).”
So far the S&P’s price action has meet all the qualifications needed to authenticate the ‘sell in May, go away' pattern. It does appear that the bearish pattern arrived early.
However, the May top has a tendency to appear as a double top, so it’s quite reasonable to expect another assault on the April 11 high over the coming weeks.
|