The Federal Reserve is watering (or drowning) growth investors and dehydrating income investors. The slim pickings interest rate environment is forcing investors into high yield/high risk vehicles, such as high yield or junk bonds.
High yield bond issuance saw a record high of $346 billion in 2012. In the first quarter of 2013, investors already gobbled up an additional $90.4 billion. Due to unprecedented demand, junk bond yields hit a record low 6.11% in January 2013.
Based on the BofA Merrill Lynch US High Yield Master II Option-adjusted Spread, junk bonds now yield only 4.79% more than US Treasury bonds.
Perhaps with a guilty conscience, the Fed has provided the liquidity needed to neutralize the usually associated with high yield (or more truthfully called junk) bonds.
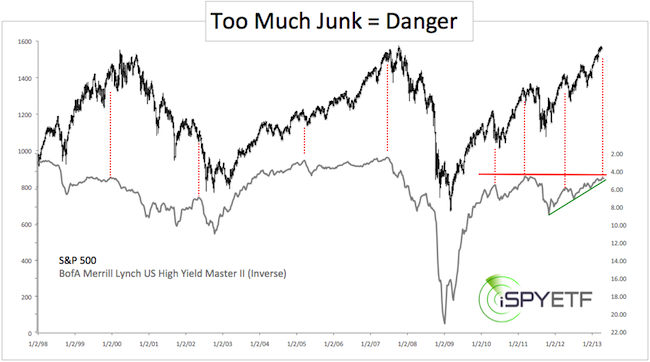
Nevertheless, as the chart below illustrates, the spread below Treasury bond and junk bond yields is approaching a range that’s been troublesome for stocks.

The chart plots the S&P 500 against the inverted (to better illustrate the correlation) BofA Merrill Lynch US High Yield Master II Option-adjusted Spread.
The red dotted lines highlight the correlation between yield spread lows and market highs. The solid red line stands for yield resistance, the solid green line for yield support.
The current constellation means that risk for stocks is rising. In itself that doesn’t mean that we’ll be confronted with a major market top like 2007, but it increases the odds for a stock market pullback.
Since junk bonds perform similar to stocks, it may be appropriate to scale back or sell junk bond ETFs like the SPDR Barclays High Yield Bond ETF (JNK), or iShares iBoxx High Yield Corporate Bond ETF (HYG). JNK and HYG have both fallen below trend line support, emphasizing the bearish yield spread message.
Treasury ETFs, including the iShares Barclays 20+ year Treasury Bond ETF (TLT) should benefit from a decline in junk bond prices.
In fact, the Profit Radar Report issued a buy signal on long-term Treasuries on March 18, when TLT was still trading at 116.
|