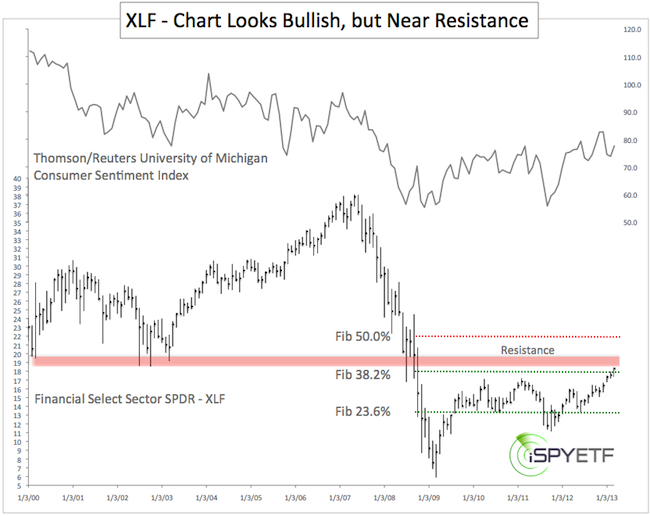
Since 2007, the financial sector has tracked consumer sentiment closer than any other sector. The chart below plots the Financial Select Sector SPDR ETF (XLF) against the Thomson/Reuters University of Michigan Consumer Sentiment Index.

Consumers aren’t nearly as confident now as they were in 2007 and the financial sector is far away from its 2007 high.
The comparison between consumer sentiment and XLF is more of anecdotal than predictive value, but the chart of XLF does provide some technical nuggets.
XLF is now trading above Fibonacci resistance at 18.21. This Fibonacci level corresponds to a 38.2% retracement of the points lost from 2007 – 2009.
The move above Fibonacci resistance is bullish and resistance now becomes support.
However, a resistance level made up of several lows reached in 2000, 2002, and 2003 is immediately ahead at 18.52 – 19.66.
Financials, as with the rest of the market, have enjoyed an incredible run, but investors have come to love financials a bit too much.
Current sentiment towards financials is almost the polar opposite to what the Profit Radar Report noted on August 5, 2012:
“Financials are currently under loved (who can blame investors). Of the $900 million invested in Rydex sector funds, only $18 million (2%) are allocated to financials. With such negative sentiment a technical breakout (close above 14.90) could cause a quick spike in prices.”
The combination of sentiment extremes and upcoming resistance suggests that some type of correction is not far away. However, the correction may be more on the shallow side. Watch Fibonacci and trend line support for more clues.
|