The Weekly ETF SPY usually highlights how to make breakouts work for you, but this week’s ETF SPY is about how to avoid getting burned by fake breakouts, fake breakdowns, or as I’d like to call them, fake out breakouts.
Trend line breakouts or breakdowns confirm a change of trend (at least temporarily) about 70% of the time. We’ve used such trend line breaks to identify deeper corrections in 2010 and 2011.
However, not all breakdowns are equal. Certain patterns are notorious for creating fake out breakouts.
If you are familiar with Elliott Wave Theory (EWT), you know that markets move either in 5 (trending) or 3 (counter trend) waves.
Within the 5-wave pattern, waves 4 have a reputation for zigzagging above all kinds of support/resistance levels.
The February 3, Profit Radar Report featured a complete forecast for the year 2013 (based on technical analysis, seasonality and sentiment). Directly ahead, at least based on my analysis, was a wave 4 correction.
Here’s how the February 3, PRR described what might be ahead: “Frustrating and seemingly aimless but powerful up and down moves should eventually retrace about a Fibonacci 38.2% of the preceding wave 3. The S&P is likely to spend much of February and March in a choppy correction.”
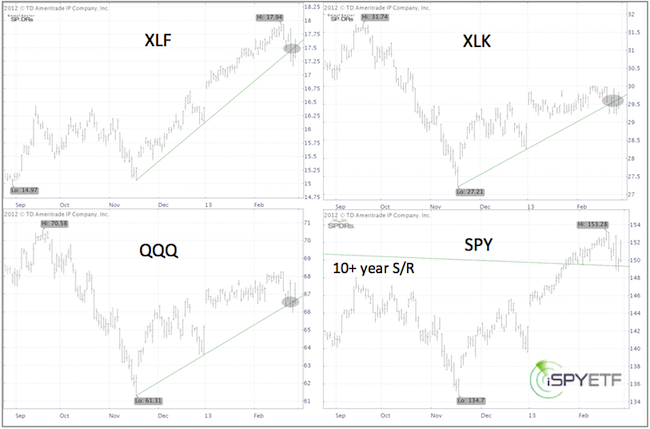
It’s too early to tell if we are in a fourth wave, but we were prepared for fake out breakouts. The chart below shows false breakdowns for four key ETFs: XLF, XLK, QQQ and SPY.
All four break below support, but we didn’t use it as a sell signal. Quite to the contrary, we used the 10+ year support/resistance line for the SPY ETF as a stop-loss for short positions and closed our short positions at S&P 1,491.
In summary, trend line breaks are one of my favorite indictors, but they must be viewed in context. If you don’t open your eyes to the bigger picture, you open your portfolio to bigger losses.
Make the ETF SPY work for You >> Sign up for the FREE iSPYETF Newsletter to receive the Weekly ETF SPY Pick

|