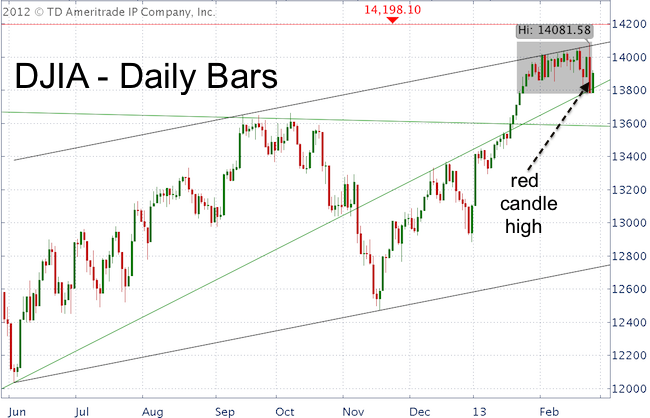
The Dow Jones Industrial Average (DJIA) reversed trends with an exclamation mark on Monday. After spiking to a new recovery high, the DJIA (corresponding ETF: Dow Diamonds – DIA) fell to a 21-day low.
A chart simply and elegantly displays a 'bad day' like this with a big red candle. This one red candle engulfs the 21 previous candles (shaded gray box).
This red candle high is also called a reversal candle. Candles like it tend to mark trend reversals. In this case from up to down. This doesn’t mean the Dow can’t and won’t eventually move higher (short-term bullish developments discussed below), but it cautions of lower lows ahead.
Two other facts enhance the message of this red candle. The high occurred right against a parallel channel anchored by the June/November 2012 lows and September 2012 high.
Perhaps even more importantly, the Dow stalled and reversed just before its all-time high water mark at 14,198.10. The Dow’s all-time high is huge resistance.
The February 18 Profit Radar Report referred to the all-time high resistance: “Next week has a bearish seasonal bias. With its all-time high just ahead, the Dow has a well-defined resistance level for a short trade. Aggressive investors may short the Dow close to its 2007 high with a stop-loss at 14,200.”
At the Profit Radar Report we call this kind of a trade a low-risk trade. Why? Because we were only 200 points or 1.5% away from the stop-loss level.
One Swallow Doesn't Make a Summer
But one swallow doesn't make a summer one one red candle doesn't make a bear market. After two 90% down days (February 20, 25) stocks were likely to rally. That's why Monday's (February 25) Profit Radar Report recommended to cover short positions at S&P 1,491.
In addition the VIX triggered a sell signal (buy signal for stocks) yesterday. Although I think that stocks will slide to a lower low, it will take a break below support or a spike to resistance to place a possible short bet. Important short-term support/resistance levels are outlined in the Profit Radar Report.

|