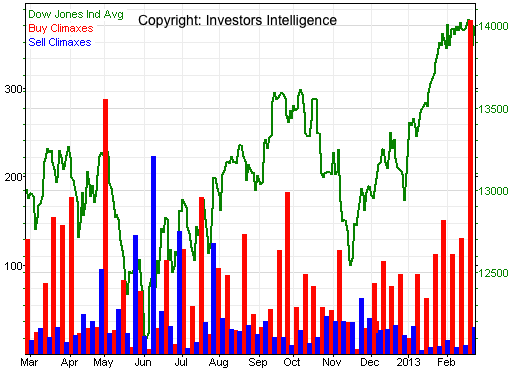
On February 13 (Stock Buying Climaxes Are On The Rise) we took a look at stock buying climaxes as published by Investors Intelligence. At the time we saw three consecutive +100 readings.
Buying climaxes happen when stocks are moving from strong hands to weak hands. They are a sign of distribution.
The February 13 article concluded with this warning: “The last time we saw three consecutive +100 readings was in March/April 2012. Stocks corrected about 10% thereafter.”
A buying climax occurs when a stock makes a 12-month high, but closes the week with a loss. Last week the S&P 500 and the SPDR S&P 500 ETF (SPY) recorded their very own buying climaxes as they recorded new recovery highs, followed by a weekly red candle.
This was a bearish sign. In addition to the weekly red candle, there was a big red daily reversal candle on February 20.
The February 24 Profit Radar Report referred to this reversal candle and stated: “The big red February 20 reversal candle cautions that this rally (referring to Friday’s bounce) may be just part of a counter trend bounce” likely to “test trend line resistance at 1,519/1,525.
The accompanying recommendation was to let the rally play out but short the S&P 500 once it breaks below support at 1,514.
Not only did the S&P break below 1,514, Monday’s data also shows that 376 stocks recorded buying climaxes last week.
Buying climaxes are just one of the many data points monitored by the Profit Radar Report. Technical analysis, sentiment readings, VIX, and S&P 500 seasonality, are used to identify low-risk trade setups.

|