A stock that’s trading at all-time highs has little overhead resistance and an unobstructed view to even higher prices targets.
After a truly nasty 18% selloff in October/November 2012, Google soared to new all-time highs. What’s next from here?
Like any other momentum move, Google’s momentum run will eventually take a breather. A number of indicators suggest that any upcoming correction may be more on the shallow side.
But there’s no law that says you need to suffer through corrections hoping that it remains fleeting and short-lived.
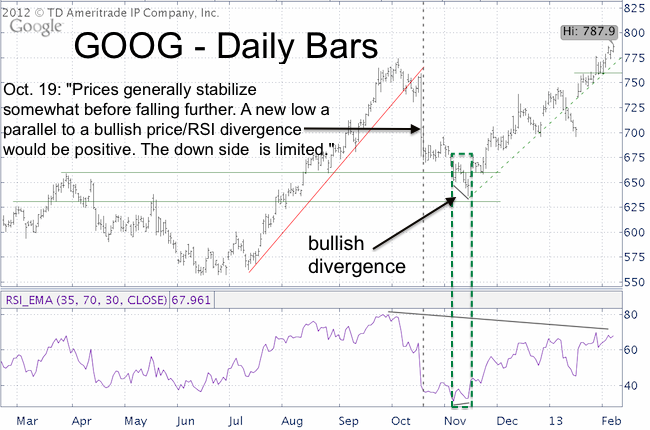
The chart below shows a dashed green trend line. A break below would be a first warning sign. A close below the horizontal support line at 760 would open the door to further losses.
Our last Google update (Will Google’s Fumble Take Down the Entire Technology Sector) was posted on October 19 (dashed vertical gray line) and said:
“GOOG trading volume was through the roof as prices tumbled below the 20 and 50-day SMA and a couple of trend lines. Prices generally stabilize somewhat after large sell offs like this before falling a bit further. A new low parallel to a bullish price/RSI divergence would be a near-term positive for Google.”
The down side risk for Google and the entire tech sector was limited as the article pointed out that: “Next support for GOOG is around 660 and 630. The Nasdaq Indexes and the Technology Select Sector SPDR (XLK) has been much weaker than the Dow Jones and S&P 500 as of late. There were no bearish divergences at the recent S&P and Dow highs. This lack of indicators pinpointing a major top limits the down side of the tech sector.”

The lower green lines represent support at 660 and 630. Following a period of stabilization in late October, Google fell as low as 636 against a bullish RSI divergence and has been rallying ever since.
There’s no solid evidence that Google’s run is over, but RSI at the bottom of the chart is showing signs of fatigue and bearish divergences on multiple timeframes.
Bearish divergences can go on for a while and in itself are no reason to sell, but the bearish divergences combined with a close below 760 would point towards more weakness and could be used as a signal to go short for aggressive investors.
Don’t miss future analysis on market heavy weights like Google, Apple & IBM. Sign up for iSPYETF’s FREE e-Newsletter.
|