“Red sky at night, sailor’s delight; Red sky at morning, sailor take warning.”
“If twice rotates the weather vane, its indicating wind and rain.”
Farmers are dependent on weather to grow their crop. Decades of watching weather patterns have resulted in folk wisdom such as quoted above. Decades of watching stock market performance has yielded Wall Street folk wisdom (if you can use Wall Street and wisdom in one sentence) like: “Sell in May and go away,” “Santa Claus Rally,” “January Barometer” and others.
Seasonality does for market forecasters what weather patterns do for farmers and meteorologists. They are valuable but not infallible.
Mid-year Seasonality Check
This article will take a look at how the S&P 500 (SPY) has conformed to seasonal patterns thus far in 2012 and what the seasonal biases are for the rest of the year.
Before we look at seasonal biases, it’s good to point out that since 1950, the S&P (SPY) was up 46 out of 62 years (74%). Since 1970, the S&P (SPY) was up 32 out of 42 years (76%).
Therefore, averaged over decades, even seasonal rough spots like February, May, and September are reduced to average monthly losses of no more than half a percent.
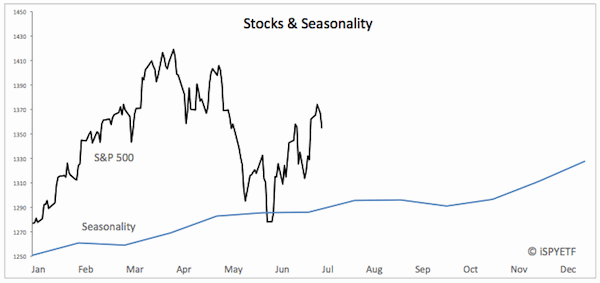
The first chart plots the S&P 500 (SPY) against seasonality. The underlying data for seasonality is the average monthly performance of the S&P since 1950.

We see that “sell in May and go away” proved to be the right move, although the May correction was more pronounced than seasonal weakness suggested. Aside from perhaps a small summer rally (which may have come early in June), seasonality suggests soft prices until October followed by a year-end rally.
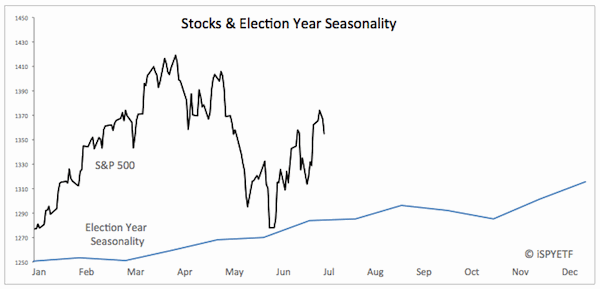
The second chart adds a twist to the generic seasonal pattern; it illustrates the S&P’s performance during election years.

One difference that makes election year seasonality stand out is a stronger than usual June – August period and a much weaker October (the weak October is largely due to the 16.9% loss in October 2008). September is the weak link in both patterns.
Seasonality Lessons
Some look at seasonality and say it’s worth as much as this piece of folk wisdom:
“If the rooster crows on the manure pile, the weather will change or stay a while.”
Others live (and die) by seasonal patterns. The right approach lies somewhere in between.
Seasonality for the remainder of the year suggests soft prices (but no big decline) in July and weakness going into September/October followed by a strong year-end rally.
High probability trading opportunities are ideally confirmed by seasonality (such as the May 2011 sell and October 2011 buy signal), but sometimes other market forces (sentiment, technicals, money flow) simply overpower seasonal biases.
Rather than focusing on one indicator, the Profit Radar Report takes a multi-dimensional approach to trading, which includes technicals, sentiment, seasonality, cash flow, fundamentals and yes, seasonal patterns.
|