| |
Articles
 |
By Simon Maierhofer | Friday March 27, 2020
The stock market has been operating in an environment of extremes. The first half of March delivered selling pressure never seen before, and the last week of March buying pressure like never seen before. What does this mean?... >> READ MORE...
|
| |
 |
By Simon Maierhofer | Thursday March 19, 2020
In January, oil prices traded as high as 65.65, but have fallen since as low as 20.52 and reached the Profit Radar Report’s 'crazy' down side target. Does the 68% crash (in about 2 months) mean that oil is done falling?... >> READ MORE...
|
| |
 |
By Simon Maierhofer | Thursday March 19, 2020
Question: I read somewhere that you compared US Treasuries to Tesla. Is that true? Yes it is, but for this comparison to make sense, we have to look at one key parallel … and it’s not a good one for Treasuries.... >> READ MORE...
|
| |
 |
By Simon Maierhofer | Thursday March 19, 2020
Stocks and humanity are in turmoil like never before. During times of panic, gold is supposed to provide a ’safe haven.’ This, however, has not been the case. In fact, one indicator predicted gold would fail miserably as ‘safe haven.’... >> READ MORE...
|
| |
 |
By Simon Maierhofer | Thursday March 12, 2020
The S&P 500 just suffered its quickest loss from an all-time high ever. The damage thus far: -26%. There is fear, there is panic, there is ‘blood in the streets.’ Based on history, how bad can it get?... >> READ MORE...
|
| |
 |
By Simon Maierhofer | Thursday February 27, 2020
Talk about taking the stairs up and elevator down. This week the S&P 500 erased 85 days worth of gains. Coming from an all-time high, that’s never happened before. What does it mean for stocks going forward?... >> READ MORE...
|
| |
 |
By Simon Maierhofer | Wednesday February 05, 2020
Our models projected elevated risk of a pullback for late January … and the S&P 500 just lost and gained more than 100 points in less than 2 weeks. Does this mean that risk has been flushed out, or should we expect renewed weakness?... >> READ MORE...
|
| |
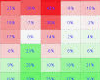 |
By Simon Maierhofer | Wednesday February 05, 2020
Imagine having a simply graphic that visually illustrates when to expect the most stock market risk or the best reward. The Risk/Reward Heat Map is a sophisticated stock market ‘pros and cons’ list that visually expresses risk and reward.... >> READ MORE...
|
| |
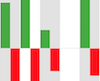 |
By Simon Maierhofer | Thursday January 09, 2020
Looking at the universe of stock market indicators, we are seeing two kind of legitimate extremes right now: Momentum has rarely been stronger. Sentiment has rarely been more bullish (which is bearish for stocks). Here is a new tool to assess risk vs reward.... >> READ MORE...
|
| |
 |
By Simon Maierhofer | Thursday December 05, 2019
The S&P 500 had closed above it’s 10-day SMA for 36 days, one of the longest momentum streaks ever, but then erased 1 month of gains in only 3 days. What’s the risk and reward going forward?... >> READ MORE...
|
| |
|
Previous | 10 | 11 | 12 | 13 | 14 | 15 | 16 | 17 | 18 | 19 Next
|
|
|
|
