| |
Articles
 |
By Simon Maierhofer | Thursday December 05, 2013
Record. There’s been a lot of talk about record all-time highs. The term all-time high has even gotten its own acronym – ATH. However, there’s another record that’s gone unnoticed thus far, but it deserves our attention.... >> READ MORE...
|
| |
 |
By Simon Maierhofer | Thursday December 05, 2013
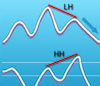
Since Friday, the Dow Jones has declined 2% and erased two weeks worth of gains. This is by no means a meltdown, but nevertheless somewhat unusual during strong December seasonality with QE. There’s a three-letter explanation.... >> READ MORE...
|
| |
 |
By Simon Maierhofer | Wednesday December 04, 2013
Thanks to QE, contrarian investors have become an endangered species. Going short prematurely has ‘killed’ many. The surviving contrarians suffer from PTPSD (post-traumatic premature short disorder). In times past, this extreme would get contrarians excited.... >> READ MORE...
|
| |
 |
By Simon Maierhofer | Tuesday December 03, 2013
Purely judging on price, the major U.S. indexes did well in November. And while price is what matters, there were subtle signs of internal weakness, not visible to ‘price watchers.’ Here’s why those signs of weakness just started to matter.... >> READ MORE...
|
| |
 |
By Simon Maierhofer | Friday November 29, 2013
Stocks are known to run on bullish fumes going into the Thanksgiving holiday, but running out of gas thereafter. The ‘tryptophan effect’ doesn’t only hit investors, it seems to also embalm Wall Street.... >> READ MORE...
|
| |
 |
By Simon Maierhofer | Monday November 25, 2013
The Financial Select Sector SPDR ETF (XLF) is leading the charge to new (recovery) highs. Unlike the major market indexes, XLF is still having to deal with overhead resistance, such as this solid Fibonacci level.... >> READ MORE...
|
| |
 |
By Simon Maierhofer | Friday November 22, 2013
Ben Bernanke is not only Wall Street’s best friend. The media, in particularly the financial media, loves him too (although begrudgingly). One Bernanke-made phenomenon assures that certain reporters never run out of ink to spill.... >> READ MORE...
|
| |
 |
By Simon Maierhofer | Thursday November 21, 2013
Yesterday's performance was a shot across the bow for bulls, especially because the Nasdaq Composite closed below strong triple support. However, the Nasdaq recovered and seems intent on moving to new highs.... >> READ MORE...
|
| |
 |
By Simon Maierhofer | Thursday November 21, 2013
Every index has at least one VIP component. Apple is the VIP for the Nasdaq-100 and S&P 500. IBM and VISA are the VIPs for the Dow Jones Industrial Average. When a VIP is ailing, the index has a hard time firing on all cylinders. That’s the case for the Dow Jones right now.... >> READ MORE...
|
| |
 |
By Simon Maierhofer | Wednesday November 20, 2013
‘Dow 16,000’ or ‘bubble’ or contenders for the fictitious un-word or non-word of the year award. While the anti-appeal of the word bubble may be fictitious, the resistance provided by the Dow Jones Industrials chart is not.... >> READ MORE...
|
| |
|
Previous | 60 | 61 | 62 | 63 | 64 | 65 | 66 | 67 | 68 | 69 Next
|
|
|
|
