| |
Articles
 |
By Simon Maierhofer | Tuesday March 18, 2014
Insiders, like corporate officers and directors, are the smartest indicator of a company’s (and by extension the stock market’s) health. Unfortunately, getting access to good insider sales data is tough. Here’s one promising set of data though.... >> READ MORE...
|
| |
 |
By Simon Maierhofer | Tuesday March 18, 2014
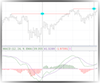
This short-term S&P 500 ETF outlook deals with two clichés - 1) Declines below the 20-day SMA on elevated volume are always bearish, and 2) The trend is your friend – and offers three interpretations (one of which is favored).... >> READ MORE...
|
| |
 |
By Simon Maierhofer | Monday March 17, 2014
Friday’s market action was unusual as stocks didn’t rally into the close to cap the week with a happy end. Despite a rough week for stocks though, the Nasdaq Indexes and Nasdaq ETF stayed above important short-term technical support. ... >> READ MORE...
|
| |
 |
By Simon Maierhofer | Friday March 14, 2014
Investors are always looking for leading indicators. Here’s one: The yen carry trade. This trade has been a recipe for success … until this week. Here’s what went wrong and what it says about stocks’ future.... >> READ MORE...
|
| |
 |
By Simon Maierhofer | Friday March 14, 2014
The S&P 500 is struggling to ‘seal the deal’ and build on the recent break out. There are multiple reasons for the lack of follow through, but this chart best explains the S&P’s dilemma with ‘escape velocity.’... >> READ MORE...
|
| |
 |
By Simon Maierhofer | Wednesday March 12, 2014
If Dr. Copper really is the kind of economic wizard many say it is, stocks are in trouble. Copper has been in a persistent down trend that’s threatening to loose further footing. Here’s a close look at copper and what its performance means (or doesn’t mean) for stocks.... >> READ MORE...
|
| |
 |
By Simon Maierhofer | Wednesday March 12, 2014
The market has been alternating between ‘risk on’ and ‘risk off,’ with a heavy emphasis on risk on. A look at stocks shows that risk on is still alive and well, but here’s one fact that hasn’t confirmed the most recent spout of risk on.... >> READ MORE...
|
| |
 |
By Simon Maierhofer | Friday March 07, 2014
It’s said that knowledge is power, and that’s largely true. But when it comes to the monthly payroll report, it’s best to ignore the data and in particular the media’s spin on the data. This is one instance where ‘ignorance is bliss.’... >> READ MORE...
|
| |
 |
By Simon Maierhofer | Friday March 07, 2014
The S&P 500 has rallied strong and most professional money managers missed that move. Is it too late to jump back on? How the S&P 500 reacts to this inflection point should provide helpful clues.... >> READ MORE...
|
| |
 |
By Simon Maierhofer | Friday March 07, 2014
Have you ever felt like a fool for selling at the worst of times? This article won’t get your money back, but it’ll put a smile on your face and show that the financial pros' timing may be even worse than the average Joe’s.... >> READ MORE...
|
| |
|
Previous | 50 | 51 | 52 | 53 | 54 | 55 | 56 | 57 | 58 | 59 Next
|
|
|
|
