| |
Articles
 |
By Simon Maierhofer | Tuesday January 19, 2016
How often can the S&P 500 follow the same script? What script? Drop into the 1,800s and rally. Investor sentiment is bearish enough to spark yet another rally, but will the fourth rendition of the same script bear (pun intended) a surprise?... >> READ MORE...
|
| |
 |
By Simon Maierhofer | Thursday January 14, 2016
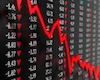
The S&P 500 lost as much as 9.75% over ten trading days. Although such declines are rare, there are enough precedents to discern a pattern of how the S&P 500 performs following such ‘rogue wave’ declines.... >> READ MORE...
|
| |
 |
By Simon Maierhofer | Thursday January 07, 2016
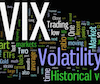
The VIX saw two massive spikes in less than a month. This is unusual (at least for most the post 2009 QE bull market), but it also happened in 2014/2015. Here is the 2014/15 pattern and the indicators that suggested a repeat this time around.... >> READ MORE...
|
| |
 |
By Simon Maierhofer | Thursday January 07, 2016
Stocks have been misfiring at a time of year that’s known for its bullish seasonal bias. Such pronounced weakness in late December/early January is quite rare, in fact it happened only three other times. Here’s how the S&P 500 fared thereafter.... >> READ MORE...
|
| |
 |
By Simon Maierhofer | Monday December 28, 2015
This is the season where the Santa Claus Rally is a popular topic of discussion. “If Santa Claus should fail to call, bears may come to Broad and Wall,” or so the saying goes. Statistically, it’s better to just ignore the Santa Claus Rally chatter.... >> READ MORE...
|
| |
 |
By Simon Maierhofer | Monday December 21, 2015
Stocks are ‘supposed’ to rally this time of year, but In terms of performance, this has been one of the worst Decembers on record. Can stocks make a stick save? Historic precedents give some unique and surprising insight.... >> READ MORE...
|
| |
 |
By Simon Maierhofer | Monday December 14, 2015
In the land of the blind, the one-eyed man is king. In the land of low interest rates, high yield bonds are king. Another, more appropriate, title for high yield bonds is junk bonds, and investors are finding out why. ... >> READ MORE...
|
| |
 |
By Simon Maierhofer | Tuesday December 08, 2015
December is the strongest month of the year, but after the December 1st pop stocks started to drop. What’s keeping a lid on bullish seasonality? This chart shows that buyers just aren’t as willing to step up as they used to.... >> READ MORE...
|
| |
 |
By Simon Maierhofer | Monday December 07, 2015
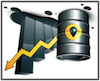
After a horrible 2014, crude oil prices dropped another 40% just since May. There are a number of reasons for lower oil prices, but one of the few indicators that saw the most recent slump coming is seasonality.... >> READ MORE...
|
| |
 |
By Simon Maierhofer | Thursday December 03, 2015
Small cap stocks have been the ‘asset class under achiever’ for much of 2015, however December is typically the best time to own small caps, and they may offer the best tell tale sign for the overall market right now.... >> READ MORE...
|
| |
|
Previous | 30 | 31 | 32 | 33 | 34 | 35 | 36 | 37 | 38 | 39 Next
|
|
|
|
