
Money makes the world go round and vice versa.
We’ve all had a front seat watching the Federal Reserve pump up stocks with QE cash.
Money is like a lubricant. Lack of money, is like ‘sand in the works.’
For the first time since 2007, we are actually seeing signs of liquidity shrinkage.
A while ago I was wondering if there is enough strength behind the latest rally leg to drive stocks to new all-time highs. And if so, could stocks sustain trade above all-time highs?
To get the answer, I turned to the same indicator that foreshadowed the 1987, 2000 and 2007 market tops, and virtually ‘guaranteed’ new bull market highs after the 2010, 2011, 2012 and 2014 correction. I call this powerful gauge ‘secret sauce’ (more later).
New All-time Highs?
Since the beginning of the 2009 bull market, the S&P 500 suffered five corrections of 9% or more (based on closing prices). The summer 2015 meltdown was the most recent one (-12.35% from high to low).
To gauge the longevity of the rally from the August 2015 panic low (S&P 1,867), we will be comparing the current rally with the rallies from the 2010, 2011, 2012 and 2014 bottoms.
With four weeks of gains in the rear-view mirror, we can do just that. As of Friday, October 23, 2015, the S&P 500 recovered slightly more than a Fibonacci 78.6% (78.85%) of the prior losses. This will be our benchmark.
If you enjoy quality, hand-crafted research, >> Sign up for the FREE iSPYETF Newsletter
To gauge the strength of the various rallies from their original low, we need more than just a price chart. We need a pulse on internal strength, buying power and liquidity.
Price and internal strength go together like horsepower (or kilowatts) and battery life. You can only judge an electric cars capability once you know horsepower and battery life. The same is true for stocks. To make a decent assessment we need to get a good feel for price and internal strength.
As mentioned earlier, my preferred strength and liquidity indicator is ‘secret sauce.’ Why ‘secret sauce’ is so potent, and why it’s called secret sauce is discussed here.
Again, we will use ‘secret sauce’ to measure and compare the strength of the S&P 500 after having retraced about 78.8% of the losses that led to major lows in 2010, 2011, 2012 and 2014.
The chart below plots the S&P 500 against ‘secret sauce.’ The blue boxes start at the pre-correction high, and end at the 78.8% S&P retracement level.
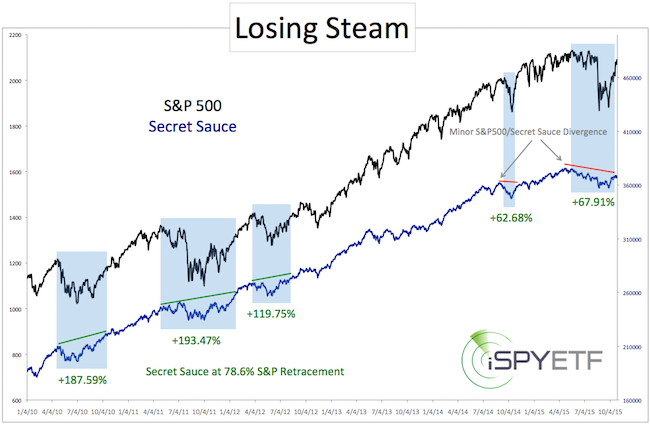
As the ascending green lines indicate, there was a ton of liquidity behind the 2010, 2011 and 2012 rallies. “Secret sauce’ retraced 119.75 – 193.47% by the time the S&P retraced 78.8% of its losses. Not surprisingly, the bull market continued plowing higher thereafter.
If you enjoy quality, hand-crafted research, >> Sign up for the FREE iSPYETF Newsletter
The rally from the 2014 low was not quite as dynamic. Although it led to new all-time highs, this particular rally turned very choppy and eventually gave back all gains.
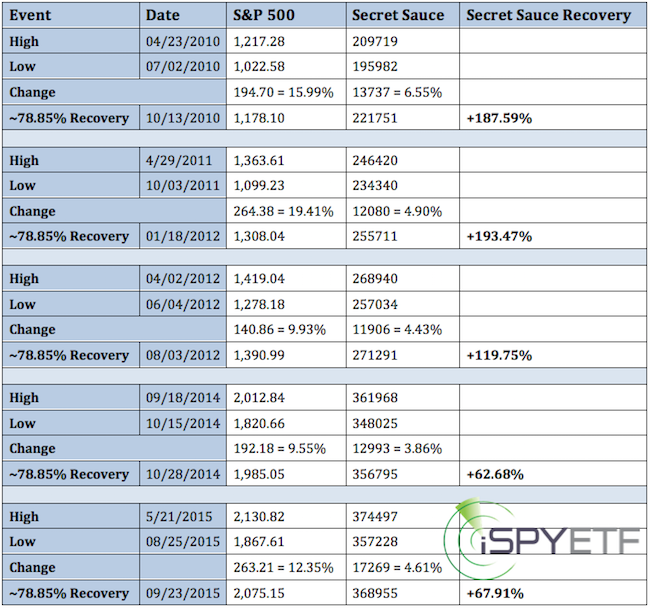
The table lists the exact details of each rally.
In one way, the rally from the August 2015 panic low is similar to the 2014 rally (‘secret sauce’ retraced barely 70% in 2014 and 2015).
However, unlike in 2014, secret sauce is flashing the same signals now as it did before the 1987, 2000 and 2007 market tops. More details here. S&P 500 Threatening to Follow 2007 Topping Pattern
Simon Maierhofer is the publisher of the Profit Radar Report. The Profit Radar Report presents complex market analysis (S&P 500, Dow Jones, gold, silver, euro and bonds) in an easy format. Technical analysis, sentiment indicators, seasonal patterns and common sense are all wrapped up into two or more easy-to-read weekly updates. All Profit Radar Report recommendations resulted in a 59.51% net gain in 2013 and 17.59% in 2014.
Follow Simon on Twitter @ iSPYETF or sign up for the FREE iSPYETF Newsletter to get actionable ETF trade ideas delivered for free.
If you enjoy quality, hand-crafted research, >> Sign up for the FREE iSPYETF Newsletter
|
