Below is a complete excerpt of the S&P 500 analysis featured in the February 28 Profit Radar Report. This is a rare, and longer than usual re-print of s subscription-based report, but I believe you’ll find it interesting and worth your time.
To put this update into context, allow me to highlight some of the comments leading up to the February 28 Profit Radar Report.
The February 11 Profit Radar Report listed six reasons why the S&P is expected to rally and recommended to buy at 1,828.
The February 17 Profit Radar Report stated the following: “The S&P 500 is now at trend line resistance (1,930) and near the February high (1,947), which is likely to introduce some selling pressure. How the S&P reacts (and recovers) to any upcoming selling pressure may set the tone for coming weeks, possibly months.”
The last observation builds a nice bride to the February 28 Profit Radar Report. Enjoy.
* * * * * * * * * *
February 28 Profit Radar Report:
Since February 17, when the S&P 500 first spiked to 1,930.68, we’ve been watching how the S&P reacts to its overbought condition. It’s been a topsy-turvy eight trading days since, but the S&P gained an additional 18 points. This is a positive development for stocks thus far.
There hasn’t been much net-movements and little new information the past week, so we’ll use the time to review and perhaps clarify our outlook and analysis.
Revisiting our Projections
The February 10 Profit Radar Report listed four projections. One was outdated (#1). One was unlikely (#4). We’ve been following the other two projections (#2 and #3) ever since. Here they are again:
If you enjoy quality, hand-crafted research, >> Sign up for the FREE iSPYETF Newsletter
2) A drop towards or just below 1,812, followed by a rally just above 1,950 and a ‘better’ bottom, likely below 1,800 (solid thick yellow line)
3) An immediate drop to new lows (or at minimum test of prior low) followed by a rally towards and likely beyond 2,040 (thick dashed yellow line)
The chart below shows both projections along with some additional information.
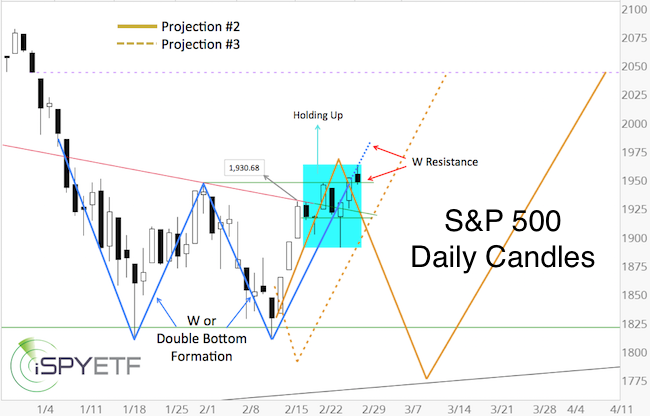
On February 11, the S&P 500 dropped to 1,810.10, which was 2.19 points below the January 20 low (1,812.29). This new low activated both projections.
Although the S&P did not drop as low as the dashed yellow line shows (projection #3), it triggered the minimum requirement for projection #3 (“immediate drop to new lows”). Projection #2 (solid yellow line) was validated as well.
If you enjoy quality, hand-crafted research, >> Sign up for the FREE iSPYETF Newsletter
Initially, the dashed yellow line (projection #2) was our preferred outlook, but as mentioned in the February 17 PRR: “The solid yellow projection has lost some of its edge, and will lose more if the S&P shrugs off short-term overbought readings without major damage.”
Classic Technical Analysis
The blue lines outline a W or double bottom formation. The projected up side target of a valid W formation is somewhere in the 2,060 – 2,100 range. What would validate the W formation?
Depending on which criterions are used, the W formation is validated with a break above the February 1 high at 1,947.20 or the January 7 high at 1,985.
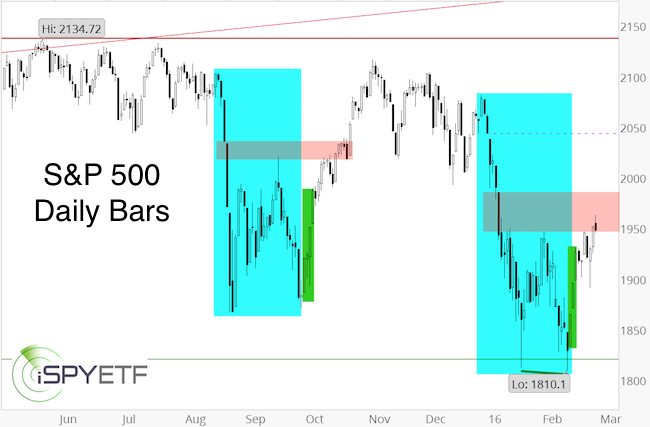
As a point of reference, the last W formation was carved out in August – October 2015 (blue box). The red bar highlights the W resistance zone(s), the green bar the post-bottom kickoff(s). A detailed analysis of the February kickoff rally (three consecutive daily gains of 1.5%+) was published in the February 21 PRR. If you are a new subscriber, take a moment to review the significance of this pattern.
2011 vs 2015
The February 7 PRR re-visited a comparison between 2011 and 2016. In 2011, the S&P broke its initial August low on October 4 against various bullish divergences. In 2016, the S&P broke its initial January low on February 11, also against various bullish divergences.
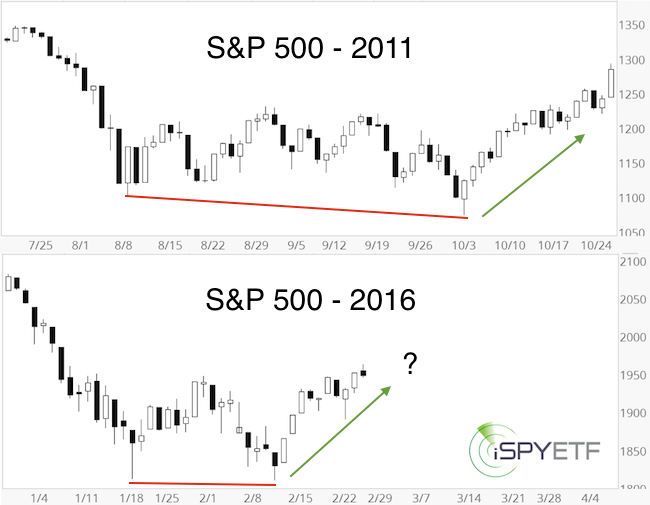
However, there were only 16 days between the January 20 and February 11, 2016 lows. In 2011, the S&P 500 chopped around for 40 days until finally carving out a lasting bottom on October 4.
In terms of price and divergences, the S&P already fulfilled the minimum requirement. In terms of time, it could take until March or April until we see a more lasting low.
If you enjoy quality, hand-crafted research, >> Sign up for the FREE iSPYETF Newsletter
Elliott Wave Theory
Based on Elliott Wave Theory, there are a number of valid interpretations. Here are a the 3 most applicable ones:
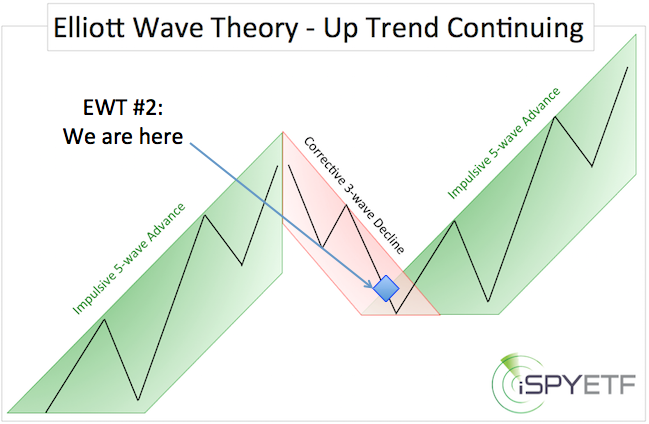
1) The S&P 500 completed a larger-scale wave 4 correction on February 11, which is to be followed by further gains and ideally new highs (dashed yellow projection #3). The conceptual chart below marks where we're at right now, assuming this scenario is playing out.
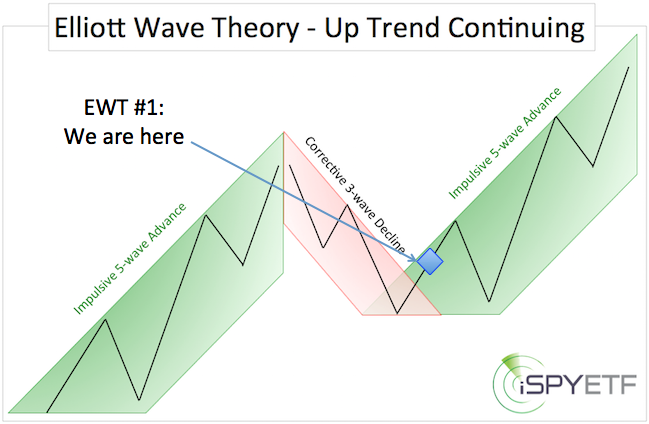
2) The S&P 500 completed the fourth wave of a larger wave 4 correction on February 11, and needs another new low to complete the larger wave 4 correction. The final correction low would be followed by further gains and ideally new highs. (solid yellow projection #2 and conceptual chart below).
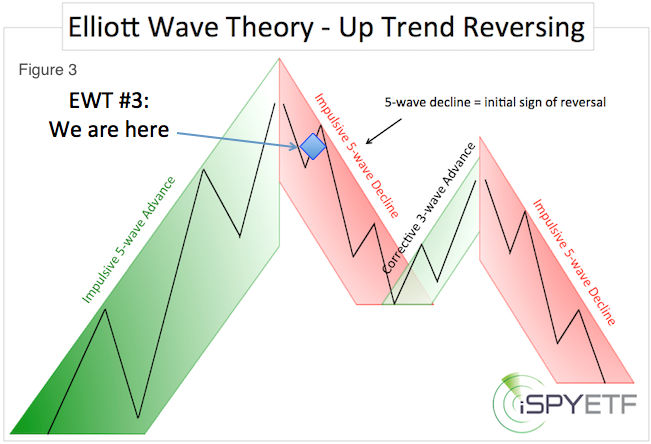
3) The S&P 500 completed wave 1 of a new bear market on February 11. The current rally is a counter trend move. Once complete, this rally would roll over into a steep decline (this scenario is unlikely, see conceptual chart below).
How to Discern the Difference
The obvious conundrum is to discern whether the S&P is more likely to follow projection #2 or projection #3.
Unfortunately, there is no way of telling. The February 15 PRR foresaw and phrased the predicament as follows: “We soon may have to decide if we want to use this trade merely as an ‘insurance trade’ against a runaway up move (in which case we hang on at least until 1,950), or if we want to cash in a somewhat respectable gain of 3-4%.”
As per the February 12 PRR: “If the S&P is going to turn lower, it should do so between 1,945 – 1,990.” The S&P entered this general turnaround zone last week.
We cashed in half of our position for a 5.2% gain. We are holding the second half in case a ‘runaway rally’ develops. More often than not, the onset of a runaway rally is unpredictable. It is not prudent to bet on the unpredictable, however, based on what we see, the environment for a runaway rally is in place.
At this point, we feel comfortable holding on to our remaining half long position, but we are not confident enough to deploy new capital.
Summary: The S&P is in the 1,945 – 1,990 region where a reversal is becoming more likely. However, the recent price action increases the odds that an upcoming reversal may only be temporary and shallow.
Immediate support is at 1,947, followed by 1,915. A move above 1,990+/- would unlock higher targets (2,040 – 2,100). A move below 1,915 would be a first step towards lower targets.
* * * * * * * * * *
End of February 28 Profit Radar Report
Since February 28, another price pattern emerged. This new pattern emphasizes the importance of the S&P 1,990 zone. All the details about this new price pattern and how it affects the S&P 500 outlook are discussed in the March 2 Profit Radar Report.
Simon Maierhofer is the publisher of the Profit Radar Report. The Profit Radar Report presents complex market analysis (S&P 500, Dow Jones, gold, silver, euro and bonds) in an easy format. Technical analysis, sentiment indicators, seasonal patterns and common sense are all wrapped up into two or more easy-to-read weekly updates. All Profit Radar Report recommendations resulted in a 59.51% net gain in 2013, 17.59% in 2014, and 24.52% in 2015.
Follow Simon on Twitter @ iSPYETF or sign up for the FREE iSPYETF Newsletter to get actionable ETF trade ideas delivered for free.
If you enjoy quality, hand-crafted research, >> Sign up for the FREE iSPYETF Newsletter
|
