Here are two facts (most investors will say they are not random):
-
QE is over.
-
Gold is crashing.
Here is a key question:
Is gold crashing because QE is over?
To get the answer, we’ll do two things: 1) Rewind and 2) Reason.
Rewind Time to 2008
Gold’s last big bull market leg started in October 2008, right after the Federal Reserve unleashed QE1.
Investors feared inflation due to the massive liquidity influx. Gold was considered as the default inflation hedge and prices soared from $680/oz to $1,900/oz.
At first glance it seems like QE1 buoyed gold. The inverse conclusion is that the end of QE may well sink gold.
Complex Analysis Made Easy - Sign Up for the FREE iSPYETF E-Newsletter
Reason & Facts
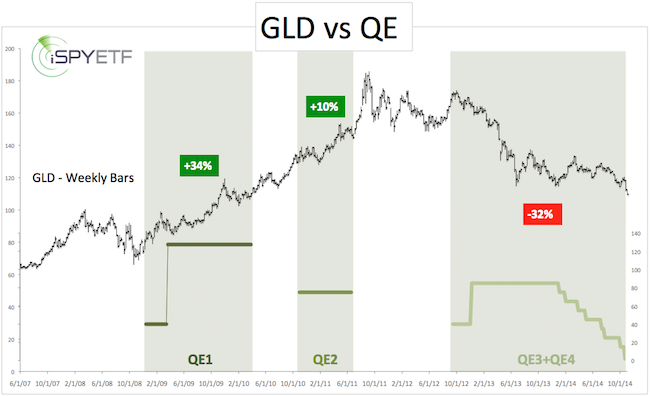
During QE1, gold prices, and gold ETFs like the SPDR Gold Shares (NYSEArca: GLD), gained 34%.
QE2 lifted GLD by 10%.
But, and that’s a big but, throughout QE3/QE4 GLD lost 32%.
The chart below plots GLD against a visual description of QE1 – QE4. QE3 and QE4 are lumped into one graph (light green) to illustrate the combined effect of both programs.

QE3 started when gold was still trading near $1,800/oz ($175 for GLD). It’s been down hill ever since.
Gold rallied during QE1 and QE2 and declined during QE3 and QE4. Statistically, the evidence shows a 50% chance that QE may or may not have affected gold prices.
I realize that there are other factors in play, but one takeaway from this chart is that the absence of QE in itself is not necessarily terrible for gold and GLD.
More Facts
The December 29, 2013 Profit Radar Report featured the following gold forecast for the year ahead:
“Gold prices have steadily declined since November, but we haven’t seen a capitulation sell off yet. Capitulation is generally the last phase of a bear market. It flushes out weak hands. Prices can’t stage a lasting rally as long as weak hands continue to sell every bounce.
Gold sentiment is very bearish (bullish for gold) and prices may bounce from here. However, without prior capitulation, any rally is built on a shaky foundation and unlikely to spark a new bull market.
We would like to see a new low (below the June low at 1,178). There’s support at 1,162 – 1,155 and 1,028 – 992. Depending on the structure of any decline, we would evaluate if it makes sense to buy around 1,160 or if a drop to 1,000 +/- is more likely.”
Complex Analysis Made Easy - Sign Up for the FREE iSPYETF E-Newsletter
Obviously much has happened since December 29, and the levels mentioned back then may need some tweaking. Nevertheless, gold has fallen below 1,178 and is trading near the 1,155 support level.
In addition, gold sentiment has soured quite a bit. Two recent CNBC articles expected gold prices to drop below $1,000 and trade at $800 next year.
The Commitment of Traders report shows increased pessimism, but not historically extreme pessimism.
The chewed out adage that fishing for a bottom is like catching a falling knife obviously applies to anyone looking to buy gold.
But based on a composite analysis of fundamentals, sentiment and price action, the falling golden knife is closer to the kitchen floor than the hand that dropped it.
The latest Profit Radar Report includes a detailed strategy on how to buy gold with minimum risk and maximum rewards.
Simon Maierhofer is the publisher of the Profit Radar Report. The Profit Radar Report presents complex market analysis (S&P 500, Dow Jones, gold, silver, euro and bonds) in an easy format. Technical analysis, sentiment indicators, seasonal patterns and common sense are all wrapped up into two or more easy-to-read weekly updates. All Profit Radar Report recommendations resulted in a 59.51% net gain in 2013.
Follow Simon on Twitter @ iSPYETF or sign up for the FREE iSPYETF Newsletter to get actionable ETF trade ideas delivered for free.

|