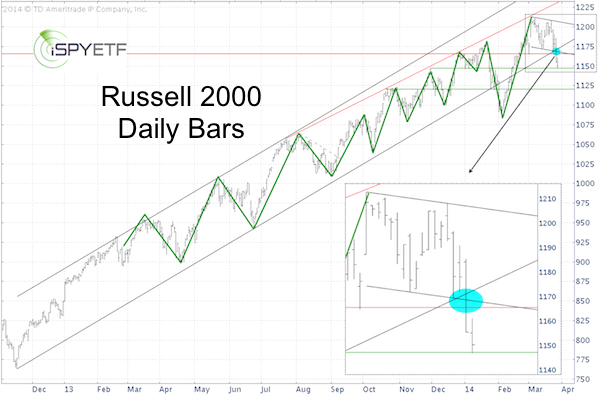
The Russell 2000 chart brings meaning to the term ‘stair-stepping higher.’
The Russell 2000 (NYSEArca: IWM) has been moving higher one leg at a time within a well-defined trend channel for over a year.
As highlighted yesterday in the Profit Radar Report, the Russell 2000 sliced below triple support and continued lower today until it hit support and captured the first down side target.

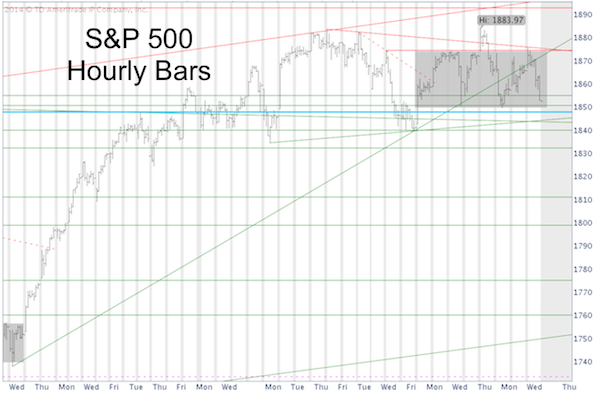
Unlike the Russell 2000, the S&P 500 closed within its trading range yesterday.
The S&P 500 (SNP: ^GSPC) chart below shows the S&P 500 as of yesterday’s close.

Yesterday’s Profit Radar Report proposed that: “Although the S&P 500 and Dow Jones remain above short-term support, the deterioration of higher beta indexes (Russell 2000 and Nasdaq) hint at more down side also for the S&P and Dow.”
How much more down side?
Here’s where the stair-step ascent makes pinpointing a down side target tricky.
Every prior high and prior low may serve as support and spark a rally.
Prior Russell 2000 support (1,165 - 1,170) is now resistance.
The Profit Radar Report monitors technicals, seasonality, and sentiment to identify high probability support levels.
A closer look at seasonality is available here:
The Most Bearish Week of Q1 is Almost Over – What about April?
Simon Maierhofer is the publisher of the Profit Radar Report. The Profit Radar Report presents complex market analysis (S&P 500, Dow Jones, gold, silver, euro and bonds) in an easy format. Technical analysis, sentiment indicators, seasonal patterns and common sense are all wrapped up into two or more easy-to-read weekly updates. All Profit Radar Report recommendations resulted in a 59.51% net gain in 2013.
Follow Simon on Twitter @ iSPYETF or sign up for the FREE iSPYETF Newsletter to get actionable ETF trade ideas delivered for free.

|