'Risk on' in one of those fashion terms linked with the QE bull market and expresses investors’ comfort level with high-risk assets.
Will risk on continue to live on?
Risk on received another shot in the arm by Shinzo Abe (Japan’s Prime Minister) and his easy money policy.
How exactly does Abenomics affect the domestic stock market?
Big Boy’s Printing Machine
The yen carry trade is like an ATM for the big boys of investing. A normal carry trade would see big institutions borrow money in countries with low interest rates and invest the money in fixed income vehicles of countries with high interest rates.
For example, if the yen had zero interest rates and U.S. bonds yielded 5%, a firm would want to borrow yen and buy U.S. bonds for a nice spread (positive carry). The biggest risk is a rising yen.
The modern yen carry trade is slightly different. Both the U.S. and Japan are pursuing a 0% interest rate policy. Institutions now borrow the yen and buy U.S. stocks.
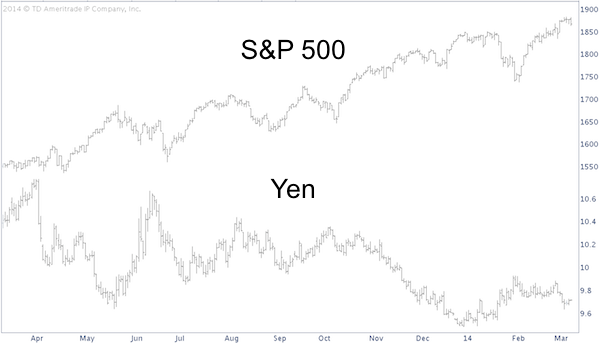
The chart below plots the S&P 500 against the Japanese yen. The yen could also be represented by the CurrencyShares Japanese Yen Trust (NYSEArca: FXY).

The widening margin between the S&P 500 (SNP: ^GSCPC) and yen is the ideal carry trade scenario. The wider the gap, the bigger the yen carry profits (a falling yen makes the yen loan cheaper).
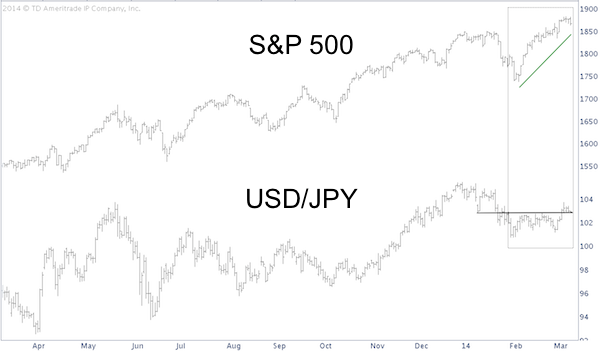
The second chart plots the S&P 500 (NYSEArca: SPY) against the USD/JPY currency pair.

The USD/JPY currency pair measures the value of the dollar and yen in relation to each other and reflects how many yen are needed to purchase one U.S. dollar.
Up until early February the correlation has been tit for tat. But the USD/JPY pair did not confirm the S&P’s recent rally. Why?
A closer look at USD/JPY provides interesting insight:

The USD/JPY pair is struggling to overcome resistance around 103.70, which is made up of the May 2013 high, ascending red trend line resistance and 61.8% Fibonacci retracement (going back to January 2 high).
While this confluence of resistance is the perfect spot for the USD/JPY rally to stop, it’s too early to say if it is enough to stall the risk on track.
103.70 is the dividing line for the risk on yen carry trade.
As long as USD/JPY stays below 103.70, carry trade and U.S. investors may have to deal with a risk off environment for a bit.
Those who have a hard time believing that there’s a rhyme and reason for the ebb and flow in the investing universe may enjoy the following article.
Although the S&P 500 has surpassed its previous all-time high (unlike USD/JPY), the S&P 500 is at a similar inflection point. What does it mean? Details here:
Is it Too Late to Jump into Stocks? Watch S&P Reaction to This Inflection Point
Simon Maierhofer is the publisher of the Profit Radar Report. The Profit Radar Report presents complex market analysis (S&P 500, Dow Jones, gold, silver, euro and bonds) in an easy format. Technical analysis, sentiment indicators, seasonal patterns and common sense are all wrapped up into two or more easy-to-read weekly updates. All Profit Radar Report recommendations resulted in a 59.51% net gain in 2013.
Follow Simon on Twitter @ iSPYETF or sign up for the FREE iSPYETF Newsletter to get actionable ETF trade ideas delivered for free.

|