The S&P 500 (SNP: ^GSPC) has closed higher seven out of the last nine trading days and shattered the short-lived mojo of stock market bears.
Here is pretty much the last hope for bears (at least over the short-term).
A deep retracement rally!
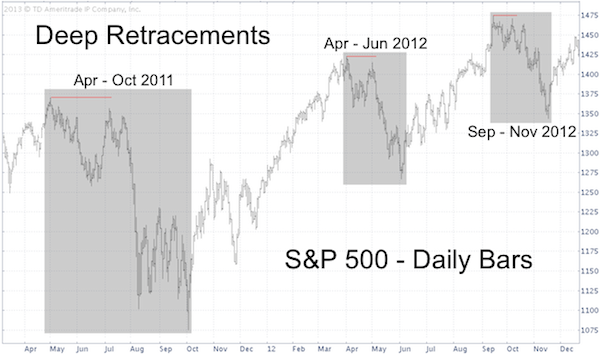
Strong bounces that retrace more than 90% of the previous decline do happen, but we have to go back to 2011 and 2012 to find the last such specimens.
The first S&P 500 chart shows deep retracement rallies in July 2011, May 2012, and October 2012. Those rallies appeared intent on taking out the prior highs, but failed to do so and were followed by new lows.

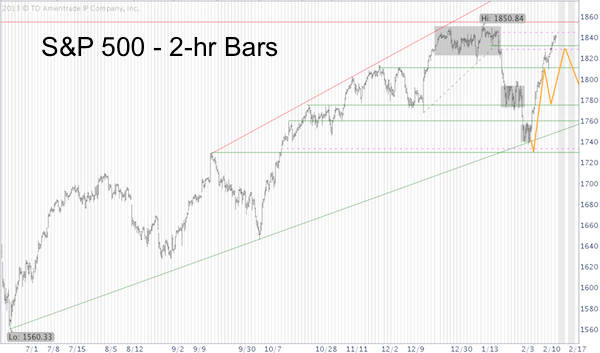
The chart below shows a projection published in the February 3 and 5 Profit Radar Report, which stated that: “Selling pressure is subsiding. The potential for a roaring rally exists.”

The February 9 Profit Radar Report added that: “Corrective bounces (rallies that retrace some of the previous decline) have been quite deep during the QE bull. The strongest resistance is around 1,830 with an open chart gap at 1,828.5.”
Obviously, the S&P 500 (NYSEArca: SPY) has already surpassed the 1,830 resistance level. This decreases the odds of an immediate trip to new lows, but so far the S&P 500 is more or less following the script outlined by the Profit Radar Report.
It may be too soon to completely abandon bearish views. Here are three bearish indicators that refuse to budge:
3 Bearish Indicators Buck the Avalanche of Bullish Signals
Simon Maierhofer is the publisher of the Profit Radar Report. The Profit Radar Report presents complex market analysis (S&P 500, Dow Jones, gold, silver, euro and bonds) in an easy format. Technical analysis, sentiment indicators, seasonal patterns and common sense are all wrapped up into two or more easy-to-read weekly updates. All Profit Radar Report recommendations resulted in a 59.51% net gain in 2013.
Follow Simon on Twitter @ iSPYETF or sign up for the FREE iSPYETF Newsletter to get actionable ETF trade ideas delivered for free.

|