The Nasdaq-100 just rallied to a new 14-year high and the sky seems the limit. But what’s a more realistic limit or target?
Here are some developments worth considering:
The first chart shows the Nasadaq-100 Index, better known by its ETF reflection, the Nasdaq QQQ ETF (Nasdaq: QQQ).

The Nasdaq-100 initially stalled at the first red line, which corresponds to the October 2000 monthly high (3,614).
The Nasdaq-100 closed above 3,614 this week. Technically, the sky is clear to the next important resistance level, which is the 78.6% Fibonacci retracement of the points lost from 2000 – 2000, located at 3,956.
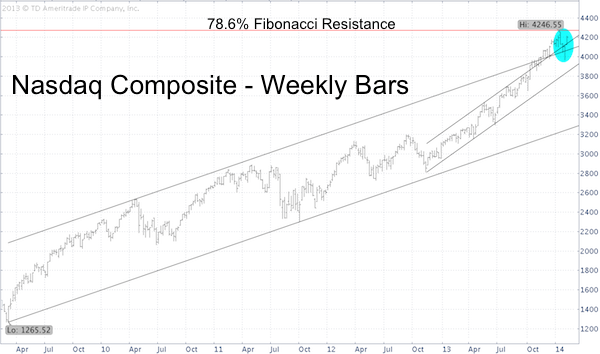
The Nasdaq Composite (Nasdaq: ^IXIC) is already within striking distance of its 78.6% Fibonacci retracement at 4,246.55.

As the two charts illustrate, only the Nasdaq-100 rallied to new highs this week. The broader Nasdaq Composite has not yet taken out its January high watermark.
This minor bearish divergence could weigh down the near-term performance. Even if the Nasdaq Composite continues higher, it will still have to deal with Fibonacci resistance at 4,246.55.
The U.S. stock market universe extends beyond the two Nasdaq indexes.
Although the Nasdaq charts suggest at least marginal gains, there’s still reason to be suspicious of this powerful bounce.
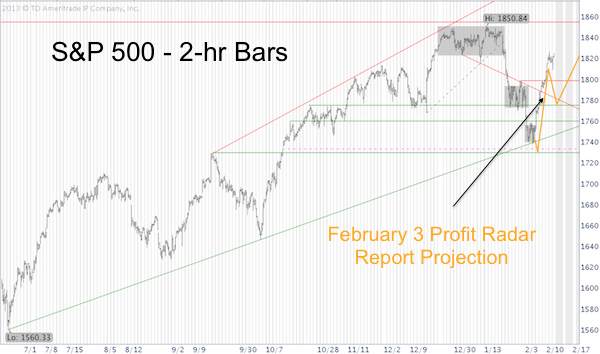
The February 5 Profit Radar Report featured this projection (yellow lines) for the S&P 500 (SNP: ^GSPC).

The S&P 500 chart projection provided a visual of the February 3 forecast: “Even though today was a rare 90% down day (90% of all stocks traded closed lower) there was a bullish RSI divergence. This suggests that selling pressure is subsiding. Ideally, the market will deliver another minor up/down wiggle before staging a larger bounce.”
The proposed S&P 500 bounce has nearly reached the projected target, so risk is increasing.
For what to expect next (short-term and long-term) and the key line in the sand between bearish risk and bullish opportunity refer to the Profit Radar Report. A detailed 2013 performance report of the Profit Radar Report and a 2014 forecast preview are available here:
Not Your Average 2013 Performance Report
Simon Maierhofer is the publisher of the Profit Radar Report. The Profit Radar Report presents complex market analysis (S&P 500, Dow Jones, gold, silver, euro and bonds) in an easy format. Technical analysis, sentiment indicators, seasonal patterns and common sense are all wrapped up into two or more easy-to-read weekly updates. All Profit Radar Report recommendations resulted in a 59.51% net gain in 2013.
Follow Simon on Twitter @ iSPYETF or sign up for the FREE iSPYETF Newsletter to get actionable ETF trade ideas delivered for free.

|