Prior to the latest Dow Jones reshuffle IBM used to rule the roost.
Effective September 20, 2013, Nike, Goldman Sachs, and Visa replaced Hewlett-Packard, Bank of America, and Alcoa.
Prior to the reshuffle IBM accounted for a whopping 10% of the Dow Jones Industrial Average (DJA: ^DJI). The Dow’s runner up VIP was Chevron with 6%.
Today IBM is only the second biggest Dow Jones component, making up ‘only’ 7.45% after VISA with a weighting of 7.93%.
Nevertheless, when one of the Dow components hits a speed bump, the Dow tends to suffer.
IBM is hitting such a speed bump right now.
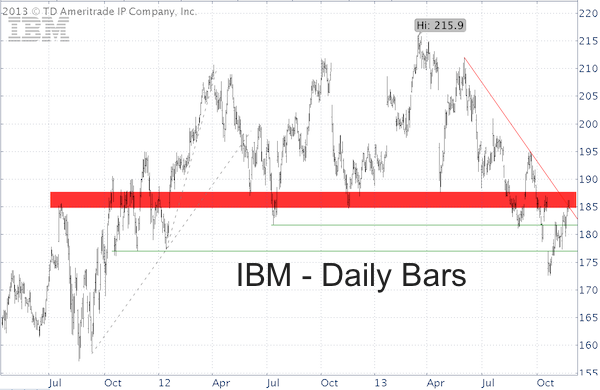
As the IBM chart below shows, trade is pausing at a descending trend line and at a wide resistance zone made up of prior highs and lows.

How come the Dow Jones Industrial Average and Dow Jones Diamond ETF (NYSEArca: DIA) have pushed to new all-time highs even though IBM is trading 14% below its high?
It has to do with the strong performance of the financial sector. The financial sector is near new recovery highs and since the September reshuffle the financial sector makes up 16% compared to 11% before the component change.
Regardless of its composition, Dow Jones and Dow Jones ETF are also gnawing at an important resistance level.
The media makes us believe this all-important milestone is round number resistance at 16,000, but it isn’t.
Here’s the Dow Jones resistance level that must be watched:
Forget Dow 16,000 – Here’s the Real ‘Bubble Popper’
Simon Maierhofer is the publisher of the Profit Radar Report. The Profit Radar Report uses technical analysis, dozens of investor sentiment gauges, seasonal patterns and a healthy portion of common sense to spot low-risk, high probability trades (see track record below).
Follow Simon on Twitter @ iSPYETF or sign up for the iSPYETF Newsletter to get actionable ETF trade ideas delivered for free.

|