A watched pot never boils. What about a ‘watched’ bubble, can it burst?
There’s been much talk about the infamous bubble and ironically, investors have been waiting in vain for the S&P 500 (SNP: ^GSPC) to pause and reverse lower:
‘Stock Bubbles, Market Troubles and Aging Bulls’ – MarketWatch
‘Cramer: Deceptive Bubble Forming in the Market’ – CNBC
‘First Take: The Bubble is Getting Bigger and Bigger’ – USA Today
‘Internet Bubble is California’s next Quake’ – MarketWatch
In fact, there’s been so much talk that the chief bubble blower to be (Janet Yellen) took it upon herself to calm fears about the omnipresent bubble.
Jim Cramer called it a ‘deceptive bubble,’ but a bubble is only deceptive if it’s unseen or illusionary.
Based on a quick eyeball estimation, about half of all financial media outlets have spotted a stock market bubble sometime in the last week.
The problem with real bubbles is that it takes hindsight to catch one. Bubbles aren’t caught, let alone predicted on live TV. If the stock market were currently in a bubble, it would be the first ever watched bubble to burst.
Bubble Trouble Memory
I looked through my notes and found another recent period when bubble talk was popular – May 2013.
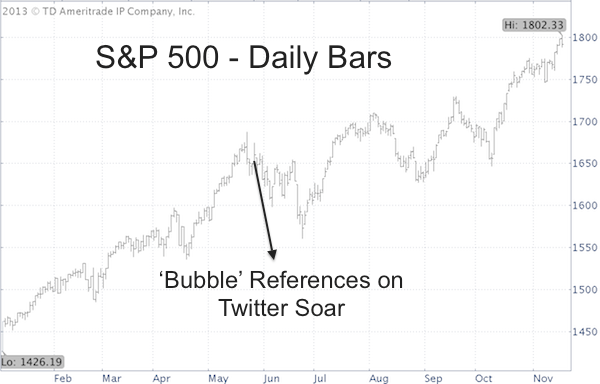
According to a MarketWatch article – ‘Bubble’ References on Twitter Soar – the volume of bubble-related tweets soared from 168 in late 2012 to almost 30,000 in April/May 2013.
The S&P 500 chart below shows how the S&P 500 performed following this ‘burst of bubble talk.’

There was a brief correction that ultimately drove the S&P 500 ETF (NYSEArca: SPY) 8% lower.
So, there was actually some truth to investors’ concerns, but instead of the expected post bubble storm there was no more than a tempest in the teapot.
Beware of Non-Scientific Headline Analysis
Obviously, this kind of financial media headline analysis is totally non-scientific and in itself doesn’t provide any actionable investment ideas.
Nevertheless, the above pattern – non-scientific as it may be – confirms the message of a very reliable set of divergence indicators. This duo of divergence indicators suggested only temporary corrections in May, August and September followed by new highs. What's the current message of this reliable 'divergence duo?'
Here’s a detailed analysis of what the two divergence indicators say is next for the S&P 500 and broad stock market.
Divergences and Their Immediate Effect on the S&P 500
Simon Maierhofer is the publisher of the Profit Radar Report. The Profit Radar Report uses technical analysis, dozens of investor sentiment gauges, seasonal patterns and a healthy portion of common sense to spot low-risk, high probability trades (see track record below).
Follow Simon on Twitter @ iSPYETF or sign up for the iSPYETF Newsletter to get actionable ETF trade ideas delivered for free.

|