Based on seasonality, there are two particularly important dates for VIX traders:
-
Early July
-
Early and late October
July marks the best VIX buying opportunity of the year.
October marks the best VIX selling opportunity of the year.
Our VIX seasonality chart is based on 25 years worth of daily closing price history.
The chart below compares VIX seasonality with actual 2014 VIX performance.
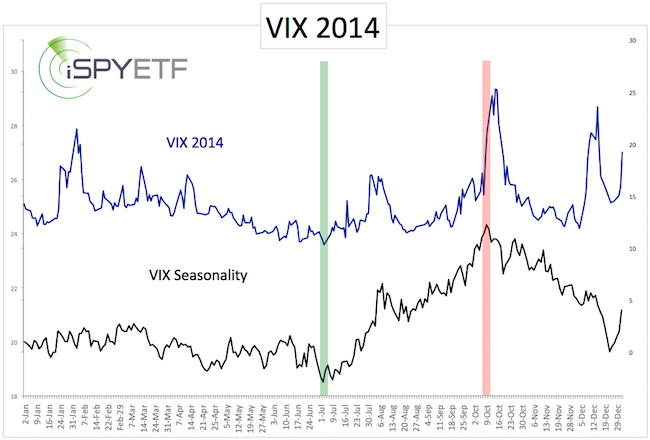
The major seasonal VIX turning points were spot on in 2014 (the Profit Radar Report pointed out both of them).
The second chart compares the 2015 year-to-date VIX with VIX seasonality.
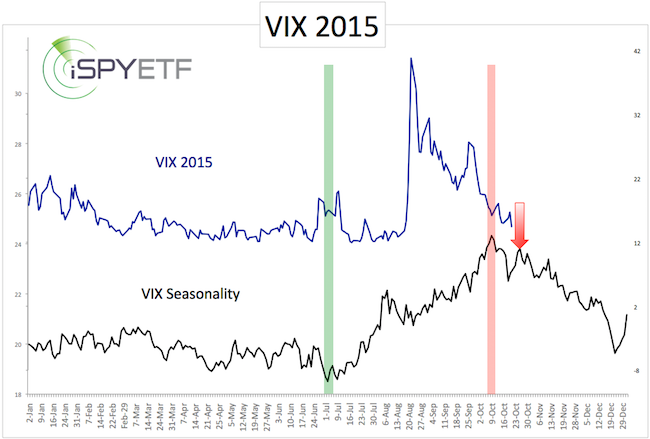
The seasonal 2015 VIX low arrived a bit early (June 23 instead of July 2).
However, the June 18 Profit Radar Report observed that: “The VIX closed at 10.57 today, the lowest reading since February 26, 2007. Today’s close was 0.04 point below the lower Bollinger Band at 10.61, suggesting that the VIX is oversold. A close back above the lower Bollinger Band is generally considered a buy signal.”
If you enjoy quality, hand-crafted research, >> Sign up for the FREE iSPYETF Newsletter
The summer VIX spike occurred during the time of year where the VIX is expected to rise.
The actual VIX high, however, occurred before the October seasonal high. Based on seasonality, there should have been another VIX spike in October. There are still a few days left for the VIX to turn lower, but the August panic VIX high certainly won’t be exceeded in 2015.
Seasonality is pointing towards lower VIX readings until mid December.
However, I would be remiss not to mention that big outlier moves, like in August/September, may alter the ideal VIX path.
That’s why the Profit Radar Report augments seasonal research with technical and sentiment analysis.
Simon Maierhofer is the publisher of the Profit Radar Report. The Profit Radar Report presents complex market analysis (S&P 500, Dow Jones, gold, silver, euro and bonds) in an easy format. Technical analysis, sentiment indicators, seasonal patterns and common sense are all wrapped up into two or more easy-to-read weekly updates. All Profit Radar Report recommendations resulted in a 59.51% net gain in 2013 and 17.59% in 2014.
Follow Simon on Twitter @ iSPYETF or sign up for the FREE iSPYETF Newsletter to get actionable ETF trade ideas delivered for free.

If you enjoy quality, hand-crafted research, >> Sign up for the FREE iSPYETF Newsletter
|
