We observed on April 21, that the stock market was actually stronger than the S&P 500 (NYSEArca: SPY) chart led to believe (Article: Under the Hood is more Strength than the S&P 500 Chart Shows).
Subsequently, the S&P 500 moved to a new all-time high on April 27 (2,126.92).
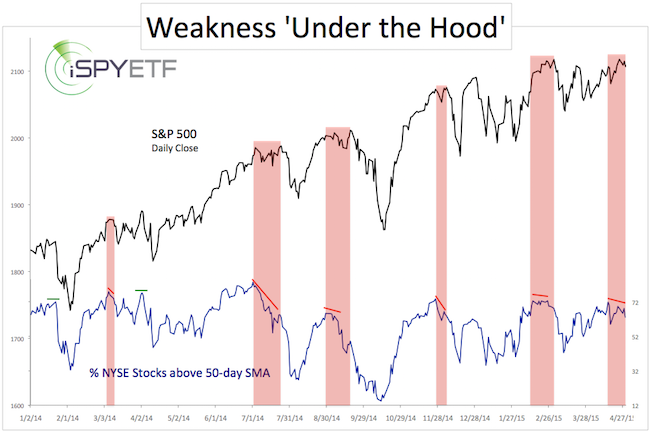
However, this condition of underlying strength quickly morphed into underlying weakness.
The April 26 Profit Radar Report observed this: “Interesting, 1-2 weeks ago, the percentage of NYSE stocks above their 50-day SMA was actually higher than the S&P 500 chart would suggest. Now, the percentage of NYSE (and S&P 500) stocks above their 50-day SMA is visibly lagging the new all-time highs. RSI is also lagging.”
The chart below shows that bearish divergences between the S&P 500 and the percentage of NYSE stocks above their 50-day SMA tend to lead to weakness (only 2 out of 8 corrections since 2014 were not preceded by this divergence).
Although the Nasdaq-100, QQQ and AAPL (Nasdaq: AAPL) staged a bullish breakout (as reported here: Nasdaq QQQ ETF Break out of Bull Flag and here: Fascinating AAPL Formation Telegraphed Bullish Breakout), the Profit Radar Report did not issue an official buy signal for the following reason:
“Based on breadth and seasonality, this rally is not built on a solid foundation. Also, the Nasdaq-100 has gapped up 1% to at least a once-year high 50 other times besides Friday. Over the next three sessions, it added to its gains only 38% of the time, averaging a return of 0.6%. Its maximum gain during the next three days averaged +1.3%, the maximum loss -3.2%.”
Never Miss a Beat! >> Sign up for the FREE iSPYETF e-Newsletter
The above-mentioned articles warned that: “The trend is up, but lagging breadth and the open chart gap suggest an eventual pullback is likely,” and “In terms of Elliott Wave Theory, any new AAPL high could complete a 5-wave move and result in a larger-scale reversal.”
AAPL spiked to a new all-time high on Tuesday (April 28) and has fallen 10 points since.
This week’s down side reversal of the S&P 500, Nasdaq and AAPL after a bullish breakout (according to technical analysis) emphasize why it is helpful to monitor multiple indicators.
That’s why the Profit Radar Report looks at supply & demand, technical analysis, investor sentiment, seasonality and price patterns for a comprehensive outlook.
How a combination of the above indicators is used to spot high probability trades is shown here (with an actual recent example): How to Spot High Probability Setups
Simon Maierhofer is the publisher of the Profit Radar Report. The Profit Radar Report presents complex market analysis (S&P 500, Dow Jones, gold, silver, euro and bonds) in an easy format. Technical analysis, sentiment indicators, seasonal patterns and common sense are all wrapped up into two or more easy-to-read weekly updates. All Profit Radar Report recommendations resulted in a 59.51% net gain in 2013 and 17.59% in 2014.
Follow Simon on Twitter @ iSPYETF or sign up for the FREE iSPYETF Newsletter to get actionable ETF trade ideas delivered for free.

Never Miss a Beat! >> Sign up for the FREE iSPYETF e-Newsletter
|
