Every time there’s political unrest somewhere on planet earth, gold prices are supposed to go up.
Every time there’s deflation somewhere on planet earth, gold prices are supposed to go up.
Every time there’s inflation somewhere on planet earth, gold prices are supposed to go up.
Every time the stock market drops, gold prices are supposed to go up.
Every wedding in India or broken rice sack in China supposedly affects the price of gold.
It’s tiring to keep track of all the forces allegedly driving gold, especially when gold is obviously having a good time defying conventional Wall Street ‘wisdom.’
Instead of overanalyzing every global conflict, monetary or currency trends and wedding seasons in far off lands, it may be worth to simply watch one chart.
The SPDR Gold Trust ETF (NYSEArca: GLD) chart below is 'dressed up' with two simple lines.
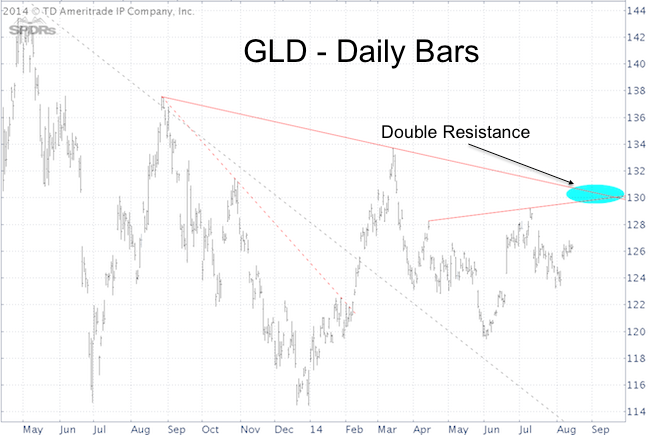
Those two solid red lines form double trend line resistance right around 130.
My research suggests that GLD may test trend line resistance, but will not surpass it.
Trade towards 130 would be a low-risk opportunity to go short (stop-loss just above trend line resistance).
The actual gold price chart is even a bit clearer than the GLD chart. Continuous updates for gold are available via the Profit Radar Report.
The moral of the GLD chart story, is not to get caught up in all kinds of unpredictable fundamental cross currents.
For anyone who wants to get a headache, Goldschlaeger schnaps may be more pleasant than following media predictions gone awry.
Simon Maierhofer is the publisher of the Profit Radar Report. The Profit Radar Report presents complex market analysis (S&P 500, Dow Jones, gold, silver, euro and bonds) in an easy format. Technical analysis, sentiment indicators, seasonal patterns and common sense are all wrapped up into two or more easy-to-read weekly updates. All Profit Radar Report recommendations resulted in a 59.51% net gain in 2013.
Follow Simon on Twitter @ iSPYETF or sign up for the FREE iSPYETF Newsletter to get actionable ETF trade ideas delivered for free.

|
