People often look for strength in numbers, but on Wall Street, ‘strength in numbers’ – also known as crowd behavior - tends to backfire.
Here is a look at one interesting chart. The chart plots the S&P 500 against the average exposure to US equity markets reported by members of the National Association of Active Investment Managers (NAAIM).
I’m a chart and numbers guy, but the message of this chart is probably more powerful if we emphasize the emotions behind the numbers, rather than just the numbers.
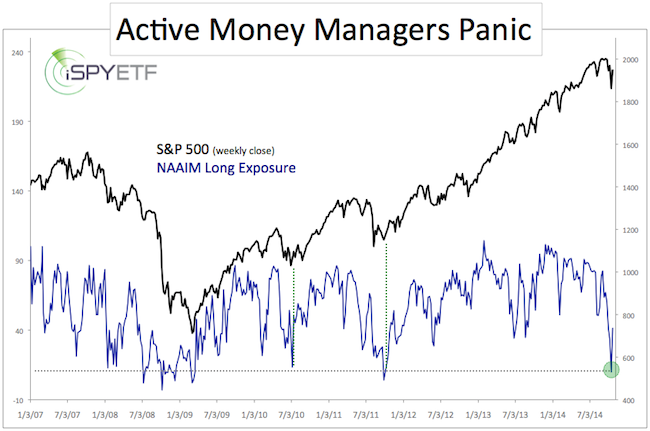
Last week, active money managers slashed their US equity exposure to 9.97%, the lowest reading since September 28, 2011.
In 2011, the S&P 500 fell as much as 21%. Last week money managers bailed before the S&P even lost 10%. They flat out panicked.
Why did money managers panic?
Were they right to panic?
Complex Analysis Made Easy - Sign Up for the FREE iSPYETF E-Newsletter
There may be a myriad of reasons why money managers decided to heavy-handedly hit the sell button, … but here is my interpretation (valued at 2 cents or more):
Obviously money managers were scared. Scared of what? The ‘big one!’
Tucked away in their memory banks were sell in May headlines such as:
-
CNBC: “This chart shows the market is a ticking time bomb” – June 11
-
Yahoo Finance: “Beware: 2014 is looking a lot like 2007” – May 22
-
CNBC: “I’m worried about a crisis bigger than 2008: Dr Doom” – May 8
The S&P 500 rallied as much as 200 points following those doom and gloom headlines. The normal reaction would be to dismiss crash calls as wrong, but money managers simply must have labeled them as ‘premature.’
The level of panic seen at the October 15 low was enough to propel the S&P as much as 140 points.
Was their panic justified? In other words, despite this bounce, did the ‘big bad bear market’ start at the September highs?
Has the “Big Bad Bear Market’ Started?
The easy and straight-forward conclusion based on the fact that money managers appear to have expected this ‘bear market’ is this:
Sure, there are plenty of reasons why stocks should roll over, but a watched pot doesn’t boil. Bear markets are rarely anticipated by the masses.
There are also persuasive reasons why this bull market has more time left. We just discussed one. Another is bullish seasonality and the absence of the most reliable bear market trigger I’m aware of.
After extensive research, I found an indicator that correctly warned of the 1987, 2000 and 2007 tops, and at the same time projected new highs in 2010, 2011, 2012 and 2013. More details here.
It is possible that the October panic lows will be tested once more, but the weight of evidence suggests that the bull market is not yet over. Short-term, the S&P 500 and Dow Jones are bumping against important resistance levels. A move above those levels is needed to unlock higher targets.
Simon Maierhofer is the publisher of the Profit Radar Report. The Profit Radar Report presents complex market analysis (S&P 500, Dow Jones, gold, silver, euro and bonds) in an easy format. Technical analysis, sentiment indicators, seasonal patterns and common sense are all wrapped up into two or more easy-to-read weekly updates. All Profit Radar Report recommendations resulted in a 59.51% net gain in 2013.
Follow Simon on Twitter @ iSPYETF or sign up for the FREE iSPYETF Newsletter to get actionable ETF trade ideas delivered for free.

|
