Apple’s slow slide lower accelerated earlier this week after falling through trend line support at 125.
This trend line buoyed prices seven times since mid-March (blue ovals), but the jug can only go to the well so often before it breaks.
Once Apple (Nasdaq: AAPL) broke below 125, it quickly moved to 120 on high volume.
120 is important, because it represents the November and January highs.
It just so happens that the 200-day SMA is just below 120.
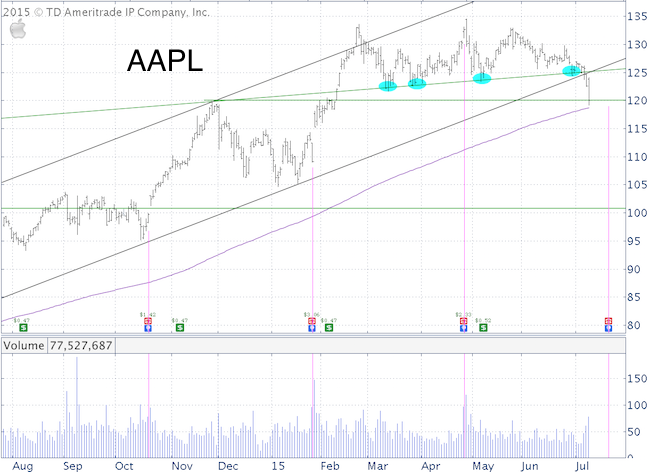
The 200-day SMA is the go-to indicator for many investors, which ironically makes it more susceptive to whipsaws.
With or without whipsaw, 120 is an important level to watch.
If you enjoy quality, hand-crafted research, >> Sign up for the FREE iSPYETF Newsletter
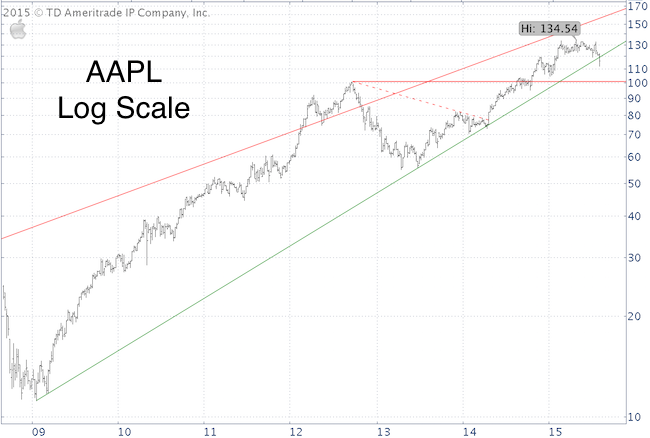
Another important level (based on the log scale chart) is 116.
In terms of AAPL's 'summer to-do-list', there are open chart gaps at 114.36 and 99.96, which may want to get filled
July 21 is an important date if you’re thinking about buying or selling AAPL. That’s when AAPL releases its earnings (after the bell).
AAPL tends to pop the day after earnings (pink), but that’s not guaranteed. The last all-time high occurred the day after earnings, and it’s been down ever since.
According to UBS, half of AAPL's revenue growth comes from China. According to FactSet, China accounts for 16.2% of AAPL's total revenue. Chinese stocks are down 30% since June 5. This could make its way into earnings ... and spook investors.
AAPL seasonality suggests being careful in July and early August. Click here for AAPL seasonality chart.
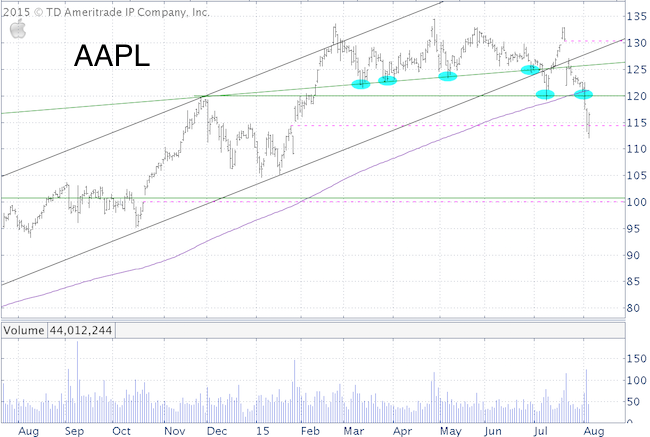
UPDATE (8/5/2015)
Support at 120 held initially, but was broken eventually. Again, the selloff accelerated once 120 failed. AAPL now closed the open chart gap at 114.36. As long as AAPL stays below resistance (120 and 125.60), it may move lower to fill the 99.96 gap. The break below trend line support (shown on log scale) could looks bearish. The only positive is the open chart gap (pink dashed line) at 130.32. Perhaps this will get filled once the correction has run its course.
Simon Maierhofer is the publisher of the Profit Radar Report. The Profit Radar Report presents complex market analysis (S&P 500, Dow Jones, gold, silver, euro and bonds) in an easy format. Technical analysis, sentiment indicators, seasonal patterns and common sense are all wrapped up into two or more easy-to-read weekly updates. All Profit Radar Report recommendations resulted in a 59.51% net gain in 2013 and 17.59% in 2014.
Follow Simon on Twitter @ iSPYETF or sign up for the FREE iSPYETF Newsletter to get actionable ETF trade ideas delivered for free.

If you enjoy quality, hand-crafted research, >> Sign up for the FREE iSPYETF Newsletter
|
