A rising tide lifts all boats. This sounds cliché, but was certainly true in 2013.
The first chart below shows the Q4 2013 performance of the nine S&P 500 sector ETFs. Those nine ETFs are:
-
Industrial Select Sector SPDR (NYSEArca: XLI)
-
Technology Select Sector SPDR (NYSEArca: XLK)
-
Consumer Discretionary Select Sector SPDR (NYSEArca: XLY)
-
Materials Select Sector SPDR (NYSEArca: XLB)
-
Financial Select Sector SPDR (NYSEArca: XLF)
-
Health Care Select Sector SPDR (NYSEArca: XLV)
-
Consumer Staples Select Sector SPDR (NYSEArca: XLP)
-
Energy Select Sector SPDR (NYSEArca: XLE)
-
Utilities Select Sector SPDR (NYSEArca: XLU)
The ETFs are sorted based on Q4 2013 performance.
More risky, high beta sectors (red colors) like technology and consumer discretionary were red hot in the last quarter of 2013.
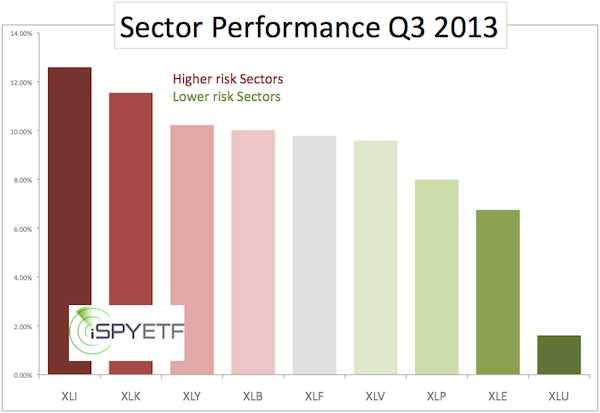
‘Orphan & widow’ sectors (green colors) like utilities and consumer staples lagged behind higher risk sectors.
The first chart is a snapshot of a healthy overall market. No wonder the S&P 500 (SNP: ^GSPC) ended 2013 on a high note.
The second chart shows that the tide turned in 2014. Conservative sectors are now swimming on top, while high octane sectors have sunk to the bottom of the performance chart.
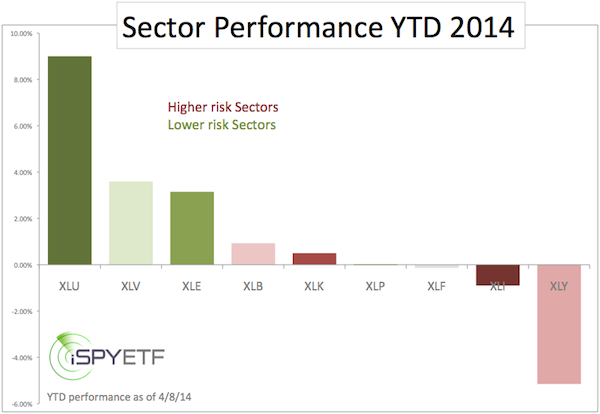
This doesn’t mean the bull market is over, but the distribution of colors illustrates that investors have lost their appetite for risk (for now).
Like graying around the temples, this rotation out of risk reminds us of an aging bull market.
It’s not yet time to order the coffin, but indicators like this do warn of the potential for a deeper correction.
This suspicion is confirmed by the most infamous sell signal of the year.
Here’s why this sell signal is so potent (aside from one silver lining).
MACD Triggers the Year’s Most Infamous S&P 500 Sell Signal
Simon Maierhofer is the publisher of the Profit Radar Report. The Profit Radar Report presents complex market analysis (S&P 500, Dow Jones, gold, silver, euro and bonds) in an easy format. Technical analysis, sentiment indicators, seasonal patterns and common sense are all wrapped up into two or more easy-to-read weekly updates. All Profit Radar Report recommendations resulted in a 59.51% net gain in 2013.
Follow Simon on Twitter @ iSPYETF or sign up for the FREE iSPYETF Newsletter to get actionable ETF trade ideas delivered for free.

|
