Are the days of “Don’t fight the Fed” over?
Obviously it’s too early to tell, but a comparison between the SPDR S&P 500 ETF (SPY) and the iShares Barclays 20+ Year Treasury ETF (TLT) reveals a new twist.
Long-term Treasury bonds might be telling the Fed: “The QE gig is up!” Why?
Stocks and bonds generally have an inverse relationship. When stocks go down, bonds go up and vice versa.
The blue boxes in the chart show that TLT rallied every time SPY declined by more than 5%. Since early 2010, when investors dumped stocks, they stocked up on bonds. When confidence in stocks ebbs, confidence in bonds flows.
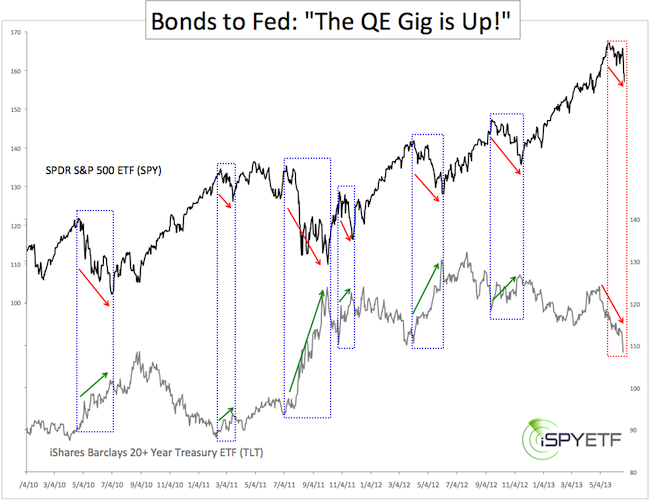
This time is different!
Since the May 28 high, SPY has fallen as much as 7.9%. At the same time TLT has lost as much as 9.1%. Yes, long-term Treasuries got hit harder than stocks.
What does this mean? In short, it’s a warning shot across the bow.
The Federal Reserve has been funneling QE-money into purchases of its own Treasuries. This (until recently) has kept prices afloat and interest rates low.
The fact that investors are dumping Treasuries despite falling stocks is an early warning sign that they have lost faith in the Federal Reserve’s ability to artificially prop up prices.
It is said that bond investors are smarter than stock investors and bond investors seem to have lost trust in the Fed’s QE. If bond investors’ suspicion spills over into the stock market, watch out.
|
