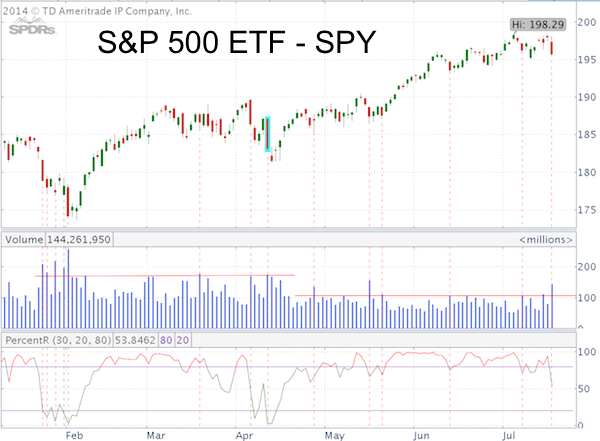
Streaks exist to be broken. The S&P 500 just broke a 66-day streak of not losing more than 1%. April 10 (blue box) was the last time the S&P 500 lost more than 1%.
Is today’s loss a bad omen?
Nowadays everything seems to be a bad omen, otherwise we wouldn’t read headlines such as:
-
"Two signs a market crash is coming"
-
"Bubble paranoia setting in as S&P 500 surge stirs angst"
-
"The indicator that proves the bull market is ending"
The S&P 500 is still within 1.5% of its all-time highs, so calls for a bull market end or crash are no doubt premature (we all know the odds of catching a falling knife).
Could today’s sell-off lead to a deeper correction?
Here are a few facts to consider:
-
Today’s loss happened on elevated trading volume. The S&P 500 ETF (NYSEArca: SPY) chart shows other recent high volume declines (dashed red lines). Some of them were followed by additional selling, but most of them were not.
-
The July 8 Profit Radar Report pointed out that 1,955 is important short-term support (on a closing basis) for the S&P 500 (SNP: ^GSPC). This support has yet to be broken.
-
The July 13 Profit Radar Report highlighted key resistance at 1,980 – 1,985. So far the S&P wasn’t able to break above resistance.
In other words, despite today’s sell-off, the S&P 500 remains range bound between support and resistance.
So could today’s decline be the beginning of a larger correction? Yes, but it could just as well be a minor buying opportunity.
Trusted indicators certainly have a better track record distinguishing one from another than attention-grabbing headlines.
In fact, one of those trusted indicators has predicted 6 of the last 8 buying opportunities correctly. If this indicator fails (and it’s at a 'do or die' point right now), it will foreshadow lower prices.
Here’s a look at this underrated and underappreciated, but accurate indicator:
S&P 500 Short-Term Forecast
Simon Maierhofer is the publisher of the Profit Radar Report. The Profit Radar Report presents complex market analysis (S&P 500, Dow Jones, gold, silver, euro and bonds) in an easy format. Technical analysis, sentiment indicators, seasonal patterns and common sense are all wrapped up into two or more easy-to-read weekly updates. All Profit Radar Report recommendations resulted in a 59.51% net gain in 2013.
Follow Simon on Twitter @ iSPYETF or sign up for the FREE iSPYETF Newsletter to get actionable ETF trade ideas delivered for free.

|
