On June 8, stocks entered my least favorite state of any rally. Overbought, but high on momentum ... impossible to predict.
A little later the S&P 500 settled in a technical vacuum between Fibonacci support at 1,955 and resistance at 1,980 – 2,000.
I didn’t know what the S&P 500 would do in that zone of ‘technical purgatory,’ but had a feeling it wouldn’t be anything meaningful.
For almost all of June and July the S&P 500 was tied to within 30 points of the 1,955 pivot.
On July 31, the stock market finally showed it had a pulse after all. The S&P 500 (NYSEArca: SPY) startled investors with the biggest weekly loss in over two years.
But most importantly (at least for my own research), the big red July 31 down day delivered a technical pattern and various other signals that made a high probability forecast possible.
With this missing piece of the puzzle, the charts made sense again. In particular the S&P 500 chart.
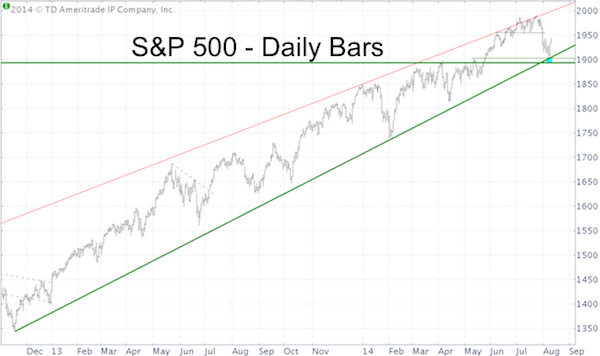
The August 6 Profit Radar Report summarized the S&P 500 constellation as follows: “The weight of evidence suggests a forthcoming bounce or the onset of another rally leg to new all-time highs. This bounce may have already started or will do so after another drop to 1,885 – 1,903.”
This bounce is now underway and how the S&P 500 will react to upcoming resistance should tell us whether this rally will power straight through to new all-time highs or roll over for another leg down (either way new all-time highs are likely eventually).
In addition to allowing a high probability forecast, the recent market action also left us with markers and trigger levels that will readily validate or invalidate my forecast.
My preferred forecast, along with key resistance and trigger levels is available via the Profit Radar Report.
Simon Maierhofer is the publisher of the Profit Radar Report. The Profit Radar Report presents complex market analysis (S&P 500, Dow Jones, gold, silver, euro and bonds) in an easy format. Technical analysis, sentiment indicators, seasonal patterns and common sense are all wrapped up into two or more easy-to-read weekly updates. All Profit Radar Report recommendations resulted in a 59.51% net gain in 2013.
Follow Simon on Twitter @ iSPYETF or sign up for the FREE iSPYETF Newsletter to get actionable ETF trade ideas delivered for free.

|
