In terms of seasonality, the S&P 500 is having a ‘bad’ year.
Why bad? Because the S&P has not been following its seasonal path outlined by many decades of historic price action.
Below is a look at the actual 2015 S&P 500 price action (blue line) and S&P 500 seasonality (gray line).
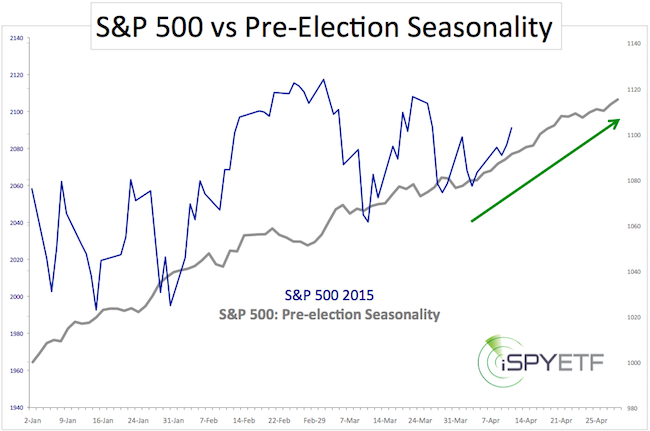
This hand-crafted S&P 500 pre-election year seasonality chart is based on daily closing prices of every pre-election year since 1951 (full seasonality chart for S&P 500 and other asset classes available to Profit Radar Report subscribers).
The general path of pre-election and overall seasonality is very similar (overall S&P 500 seasonality is based on closing prices of every year since 1950).
Never Miss a Beat! >> Sign up for the FREE iSPYETF e-Newsletter
Due to the smaller data set, and a more bullish bias, pre-election year seasonality features stronger rallies, but also deeper pullbacks.
The May rally (green arrow) is one of those moves that’s more pronounced during pre-election years.
Based on seasonality, the S&P 500 (NYSEArca: SPY) is 'supposed to' move higher into early May.
Seasonality is one of the four major market-moving forces I use to compose my market forecasts. Technical analysis, supply & demand data, and investor sentiment are the other key forces.
Detailed forecasts based on those four indicators are available to Profit Radar Report subscribers.
Simon Maierhofer is the publisher of the Profit Radar Report. The Profit Radar Report presents complex market analysis (S&P 500, Dow Jones, gold, silver, euro and bonds) in an easy format. Technical analysis, sentiment indicators, seasonal patterns and common sense are all wrapped up into two or more easy-to-read weekly updates. All Profit Radar Report recommendations resulted in a 59.51% net gain in 2013 and 17.59% in 2014.
Follow Simon on Twitter @ iSPYETF or sign up for the FREE iSPYETF Newsletter to get actionable ETF trade ideas delivered for free.

Never Miss a Beat! >> Sign up for the FREE iSPYETF e-Newsletter
|
