Many famous investors had prematurely slaughtered this bull market, and were about to make sausage with it. But the bull escaped the butcher’s knife again and again.
The list of premature bull market assassins (who missed the mark) reads like a who’s who of Wall Street:
-
Russ Koesterich, chief investment strategist at BlackRock
-
Wilbur Ross, billionaire investor
-
Carl Icahn, billionaire activist and investor
-
Robert Shiller, professor of economics at Yale
The chart below suggests that bears get another shot right about now. In terms of time and price (resistance), this is the best window of opportunity for bears yet.
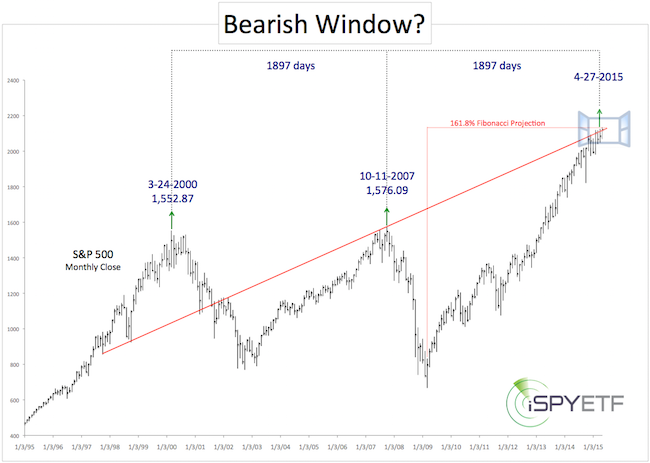
Perfect Window – Time
1897 trading days elapsed between the March 2000 and October 2007 market tops. Projecting another 1897 days from the October 2007 high brings us to April 27.
Never Miss a Beat! >> Sign up for the FREE iSPYETF e-Newsletter
Perfect Window – Price
Thus far the S&P 500 (NYSEArca: SPY) has not been able to overcome red trend line, which is derived by connecting the 2007 high with various other pivot points.
The red trend line is natural resistance and could act like a ‘red light’ for stocks (U-turn?). Regardless, it certainly explains why the S&P 500 has been stuck.
Persuasive as this chart is, it does not harmonize with my most reliable market top indicator (it correctly foreshadowed the 1987, 2000 and 2007 tops, but has not triggered a sell signal since 2009).
How do we reconcile the mixed messages of two potent charts/indicators? Here’s the conclusion that makes most sense: Is this Bull Market Circling the Drain?
Simon Maierhofer is the publisher of the Profit Radar Report. The Profit Radar Report presents complex market analysis (S&P 500, Dow Jones, gold, silver, euro and bonds) in an easy format. Technical analysis, sentiment indicators, seasonal patterns and common sense are all wrapped up into two or more easy-to-read weekly updates. All Profit Radar Report recommendations resulted in a 59.51% net gain in 2013 and 17.59% in 2014.
Follow Simon on Twitter @ iSPYETF or sign up for the FREE iSPYETF Newsletter to get actionable ETF trade ideas delivered for free.

Never Miss a Beat! >> Sign up for the FREE iSPYETF e-Newsletter
|
