Back in September, I declared 2,040 as target and later on as ‘make it or break it’ zone (Why 2,040? Is explained here).
I realize this is a strong statement, and although the S&P 500 easily reached the 2,040 target, it appears like the ‘make it or break it’ zone was a non-event. Nevertheless, 2,040 actually did what it was supposed to do. How so?
First, 2,040 acted as price target. The target was reached.
The October 4 Profit Radar Report (PRR) proposed that: “If the S&P doesn’t turn around at 1,953, the odds increase for a push to 2,040.”
What does ‘make it or break it’ mean anyway?
The October 7 PRR explained that: “The rally from the September 29 low has been stronger than it should have been, and a sustained move above 2,040 would likely mean that the correction is over. A break above 2,040 could also validate a W-bottom formation, and significantly reduce the odds of another low in 2015.”
Second, 2,040 didn’t require a reaction, but market action around 2,040 would indicate whether the S&P 500 will break the August low (1,867) or not.
If you enjoy quality, hand-crafted research, >> Sign up for the FREE iSPYETF Newsletter
The S&P moved above 2,040, thereby diminishing the odds of another low dramatically. The S&P 500 made it. This doesn’t mean there won’t be a pullback.
In addition to price, we’ve also been focusing on market breadth. Price is important, but it’s not the only thing that matters.
To illustrate, an electric car can only deliver the full horsepower (or kilowatts) if the battery is charged. An empty, or near empty battery, won’t get the driver far, regardless of how many horses are under the hood.
We wanted to see how things look under the hood as the S&P approached (and surpassed 2,040). Is there enough horsepower and battery life left to move stocks higher?
At times, market breadth was quite weak (especially on Friday, October 23). However, there were no bearish divergences suggesting a pullback.
The October 18 PRR stated that: “A decisive move above 2,040 would unlock the next up side target around 2,080.”
It would be a stretch to call the move decisive, but 2,080 was reached nevertheless.
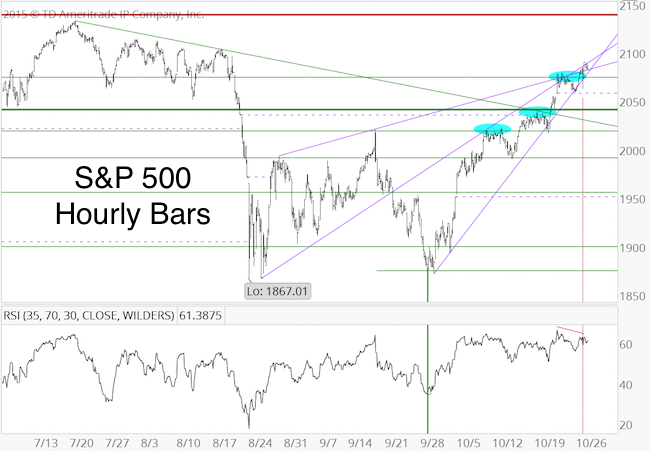
The hourly chart shows that the S&P 500 reached and eventually (after appropriate testing of resistance) exceeded all up side targets (blue ovals). There was a bearish divergence at yesterday’s high.
There is also trend channel resistance (going back to 2009) at 2,093 (increasing about 0.75 points per day).
It will now take a new RSI high and a move above 2,093 (adjusted for time) to unlock further up side targets. There is risk of a shallow pullback as long as the RSI divergence persists and trade remains below resistance.
Simon Maierhofer is the publisher of the Profit Radar Report. The Profit Radar Report presents complex market analysis (S&P 500, Dow Jones, gold, silver, euro and bonds) in an easy format. Technical analysis, sentiment indicators, seasonal patterns and common sense are all wrapped up into two or more easy-to-read weekly updates. All Profit Radar Report recommendations resulted in a 59.51% net gain in 2013 and 17.59% in 2014.
Follow Simon on Twitter @ iSPYETF or sign up for the FREE iSPYETF Newsletter to get actionable ETF trade ideas delivered for free.

If you enjoy quality, hand-crafted research, >> Sign up for the FREE iSPYETF Newsletter
|
