The CBOE equity put/call ratio fell to 0.53 yesterday, the lowest reading of 2015.
A ratio of 0.53 means that option traders bought 1.89 calls (bullish option bet) for every put (bearish option bet).
Put/call ratio extremes are generally a contrarian indicator.
Although it’s the lowest reading of the year, 0.53 is not extreme by historical standards.
The chart below plots the S&P 500 (NYSEArca: SPY) against the CBOE equity put/call ratio.
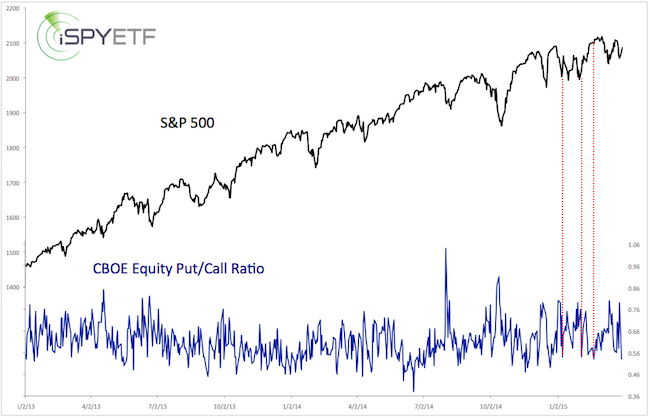
The dashed red lines highlight what happened the last three times the put/call ratio was around 0.53.
Never Miss a Beat! >> Sign up for the FREE iSPYETF e-Newsletter
Nothing too scary happened.
In general, the put/call ratio needs to drop into the mid-40s to predict trouble with a measure of consistency.
Simon Maierhofer is the publisher of the Profit Radar Report. The Profit Radar Report presents complex market analysis (S&P 500, Dow Jones, gold, silver, euro and bonds) in an easy format. Technical analysis, sentiment indicators, seasonal patterns and common sense are all wrapped up into two or more easy-to-read weekly updates. All Profit Radar Report recommendations resulted in a 59.51% net gain in 2013 and 17.59% in 2014.
Follow Simon on Twitter @ iSPYETF or sign up for the FREE iSPYETF Newsletter to get actionable ETF trade ideas delivered for free.

|
