It’s been a remarkable couple of weeks for the Nasdaq, not just in terms of performance, also in terms of ‘market oddities.’
On Friday, the Nasdaq QQQ ETF literally jumped higher, propelled by Google’s 13% gain.
However, Google’s massive rally covered up internal Nasdaq weakness. On that day more Nasdaq-100 components were actually down than up.
New highs on negative breadth is a rare feat. Nevertheless, the Nasdaq managed to do the same thing again on Monday.
The Nasdaq Composite is made up of about 3,000 stocks (compared to 100 for the Nasdaq-100). On Monday, there were 940 more stocks down than up.
Here’s another breadth measure, illustrated visually via the chart below. The upper bars represent the PowerShares QQQ ETF, the lower graph the number of Nasdaq Composite stocks at new 52-week highs.
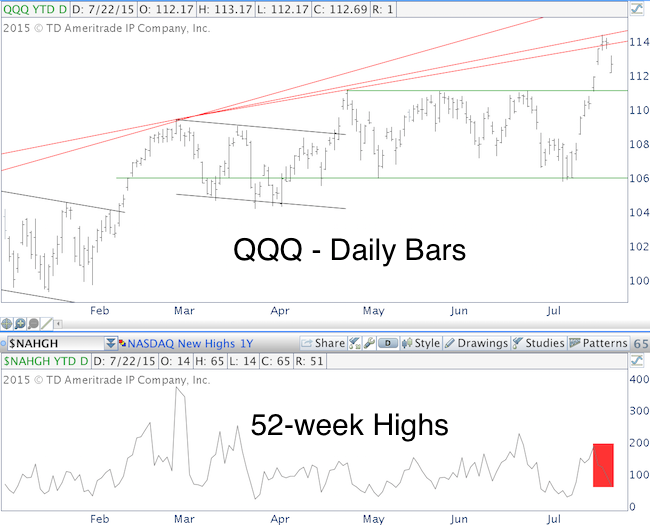
The number of stocks at new highs fell from 189 on Friday to 97 on Tuesday, a 49% drop.
My most recent Profit Radar Report highlighted lagging breadth and bearish divergences and warned of a pullback.
Regarding AAPL earnings, the Profit Radar Report said Sunday that: “AAPL is butting against minor resistance and AAPL seasonality shows some weakness in the middle of July. AAPL’s move is likely to be more subdued than GOOG.”
AAPL (Nasdaq: AAPL) dropped as much as 7% in post-earnings after market trading and gapped below support this morning. Click here for detailed AAPL analysis.
What’s next for the Nasdaq?
The bottom line, based on a number of indicators, is this: The potential for a nasty Nasdaq selloff exists, but another rally leg to new highs seems more likely. The green lines (around 111 and 106) should provide support for the QQQ. If they don't, watch out.
A more detailed analysis for the S&P 500 is available here: S&P 500 Analysis
Simon Maierhofer is the publisher of the Profit Radar Report. The Profit Radar Report presents complex market analysis (S&P 500, Dow Jones, gold, silver, euro and bonds) in an easy format. Technical analysis, sentiment indicators, seasonal patterns and common sense are all wrapped up into two or more easy-to-read weekly updates. All Profit Radar Report recommendations resulted in a 59.51% net gain in 2013 and 17.59% in 2014.
Follow Simon on Twitter @ iSPYETF or sign up for the FREE iSPYETF Newsletter to get actionable ETF trade ideas delivered for free.

If you enjoy quality, hand-crafted research, >> Sign up for the FREE iSPYETF Newsletter
|
