The latest American Association for Individual Investors (AAII) poll shows a significant drop in optimism.
Only 27.2% of individual investors are bullish on stocks. That’s the lowest reading since April 2013.
How powerful of a contrarian indicator is this?
The chart below plots the S&P 500 against the percentage of bullish AAII investors.
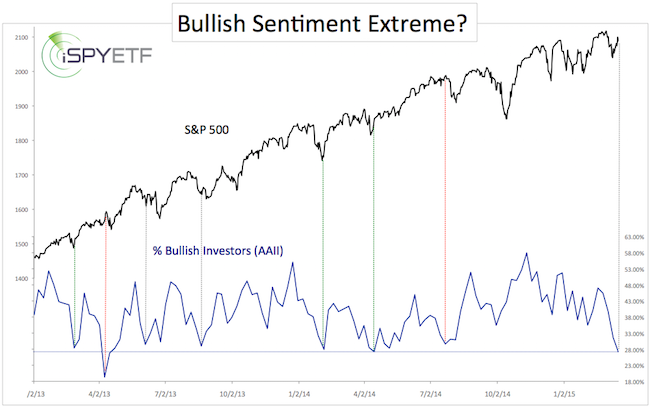
The dashed green lines mark bullish reactions to similar readings in the past, the red lines bearish reactions and the gray lines neutral (at least short-term) reactions.
Never Miss a Beat! >> Sign up for the FREE iSPYETF e-Newsletter
Well, there are six prior instances with two bullish, two bearish and two neutral outcomes. Not much of an edge.
The AAII survey generally delivers noisy data and hardly ever works as a stand-alone contrarian indicator.
Compared with the many other sentiment gauges I follow, this reading stands out as a rogue extreme.
It’s one of those data points that should be taken with a grain of salt, but as long as the S&P 500 stays above 2,100, it shouldn't be ignored either.
Simon Maierhofer is the publisher of the Profit Radar Report. The Profit Radar Report presents complex market analysis (S&P 500, Dow Jones, gold, silver, euro and bonds) in an easy format. Technical analysis, sentiment indicators, seasonal patterns and common sense are all wrapped up into two or more easy-to-read weekly updates. All Profit Radar Report recommendations resulted in a 59.51% net gain in 2013 and 17.59% in 2014.
Follow Simon on Twitter @ iSPYETF or sign up for the FREE iSPYETF Newsletter to get actionable ETF trade ideas delivered for free.

|
