If you define correction as a 10% drop, the S&P 500 (SNP: ^GSPC) hasn’t had one in well over 1,000 days.
This is the longest correction-free streak since the 1,127-day run from July 1984 to August 1987.
But, corrections are not like annual holidays, they are more like earthquakes. Corrections don’t appear on schedule and they are not always felt the same way.
Although the Richter scale may register a magnitude 3.5 earthquake, it may not be felt by all residents.
The same is true with market corrections. Not all corrections are created equal, and the ‘S&P 500 Richter scale’ may have registered a correction that wasn’t felt by every investor.
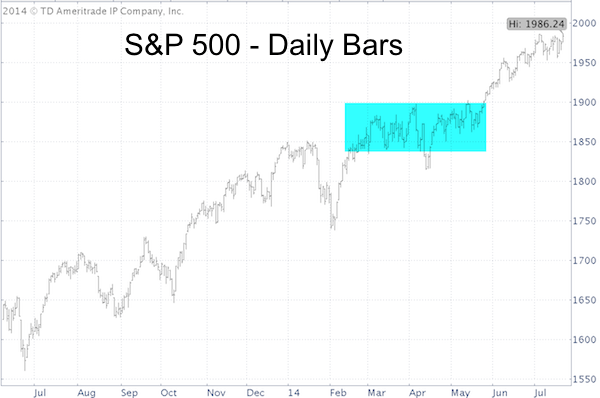
In fact, the chart below shows a perfectly legitimate correction period. How so?
Via the May 14 Profit Radar Report, I explained the ‘covert’ correction as follows:
“I’d like to take a moment to talk about the potential for an extended rally. For many months analysts have emphasized (and continue to emphasize) the need for a 10% correction. There are two ways stocks can correct: 1) Price 2) Time.
A price correction is straight-forward and easy to spot as stocks simply shed value. Time corrections are often overlooked by the investing masses as prolonged sideways trading covertly digests oversold readings and excessive sentiment.
What we’ve seen since February delivers both. The S&P 500 and Dow Jones have treaded water while the Nasdaq-100 and Russell 2000 already lost as much as 8.67% and 8.71%, the biggest correction in well over a year.
As pointed out in a number of prior Profit Radar Reports, investor sentiment has dropped quite a bit. The percentage of AAII bears is down to 28.34% and various media outlets have boldly gone on record predicting a crash or severe correction.
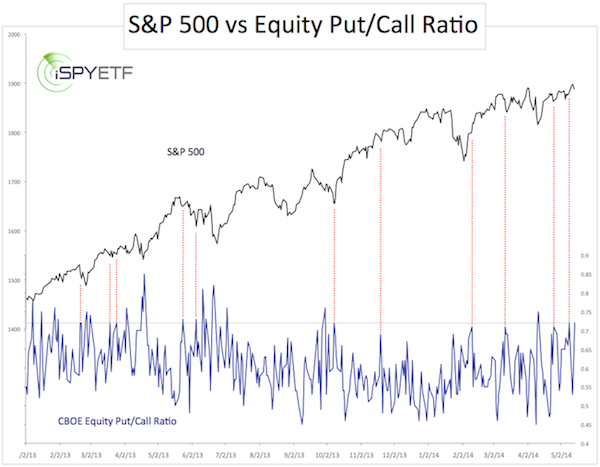
The chart below plots the S&P 500 against the CBOE Equity Put/Call Ratio. Prior corrections were preceded by a put/call ratio around 0.5 or below (= option traders buy two calls for every put). Today the put/call ratio is at 0.72, a level that’s indicative of a low more than a top.”
Below is the chart referenced in the May 14 Profit Radar Report. It shows that the S&P 500 (NYSEArca: SPY) corrected internally. 3 ½ months of sideways trading created enough of an oversold condition (based on option trader sentiment) to serve as a foundation for the next rally.
In addition, the Russell 2000 lost as much as 10.75% from March 4 to May 15.
In short, there was a correction. For the S&P 500 it was a correction by virtue of time, not price.
From April to July the S&P 500 tagged on 160 points. Now we ask if the market is due for another correction or if it will keep grinding higher?
To help discern, we look at the same indicator that projected a rally without price correction months ago. This is probably one of the most unique (und recently accurate) indicators you'll ever see:
The Only Indicator that Foresaw a Persistent S&P 500 Rally Without Correction
Simon Maierhofer is the publisher of the Profit Radar Report. The Profit Radar Report presents complex market analysis (S&P 500, Dow Jones, gold, silver, euro and bonds) in an easy format. Technical analysis, sentiment indicators, seasonal patterns and common sense are all wrapped up into two or more easy-to-read weekly updates. All Profit Radar Report recommendations resulted in a 59.51% net gain in 2013.
Follow Simon on Twitter @ iSPYETF or sign up for the FREE iSPYETF Newsletter to get actionable ETF trade ideas delivered for free.

|
