The market has been stuck in yet another waiting pattern, so we might as well use the time to look at the forces that may (or may not) jolt stocks out of their waiting loop.
According to many, overheated investor sentiment will break the stale mate and send stocks spiraling lower.
There’s just one flaw with this line of reasoning. Sentiment is not overheated.
The Profit Radar Report continuously analyzes how investors feel about stocks and publishes a comprehensive sentiment picture once a month.
The chart below, which plots the following six sentiment gauges against the S&P 500 (NYSEArca: SPY), was published in the August Sentiment Picture on August 29:
-
CBOE SKEW
-
Equity put/call ratio
-
CBOE Volatility Index (VIX)
-
NAAIM survey of active money managers
-
II survey of investment advisors
-
AAII survey of individual investors
Where are the sentiment extremes?
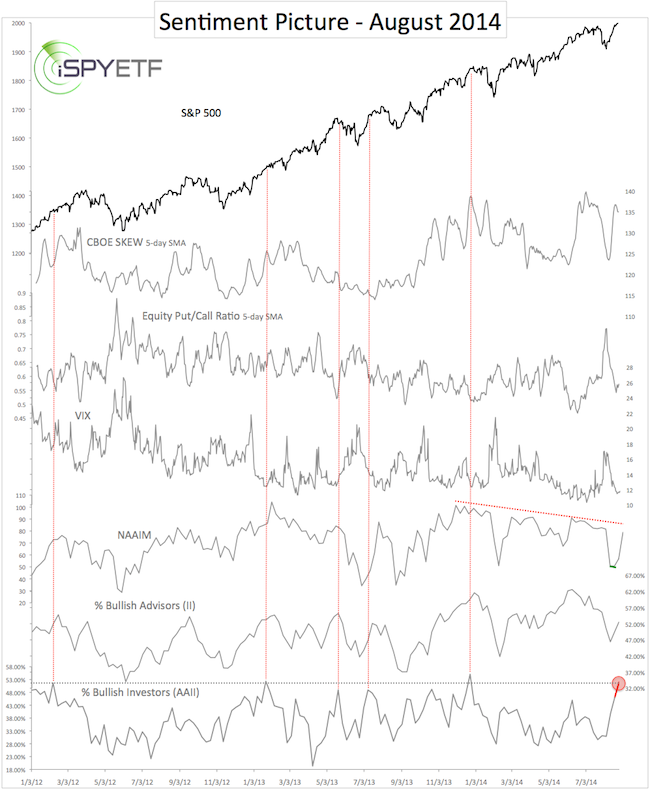
There’s only one: Last week 51.92% of individual investors were bullish. That’s the highest reading since December 24, 2013. The red lines highlight other 50%+ spikes and how the S&P 500 reacted.
Yes, the bullish December AAII reading was followed by a January pullback, but there’s a big difference between today and December: No other indicator is confirming August’s AAII spout of enthusiasm, and AAII bulls are back down to 44.70%.
There was one more extreme not illustrated by the chart: The percentage of bearish investment advisors polled by II dropped to 13.3%, the lowest reading since 1987. This is a legitimate extreme.
The August 29 Sentiment Picture summed up the big picture sentiment situation as follows:
“Perhaps most noteworthy is that we continue to see isolated sentiment extremes, but the source of such extremes only rotates (the SKEW and put/call ratio in July, the AAII poll in August), it doesn’t compound. We see different gauges hit overheated levels at different times, but never all at the same time.
The overall sentiment picture is fractured, and void of the ‘all in’ mentality seen near major market tops.
Isolated extremes cause only small pullbacks here or there.
Based on sentiment, we could see 1) a continued grind higher interrupted by the occasional 3-10% correction or 2) a prolonged period of choppy sideways trading.”
Bottom line, sentiment is not extreme enough for a big scale market top.
The most important market breadth indicator, which correctly foreshadowed the 1987, 2000 and 2007 crashes, also doesn’t show the deterioration needed for another crash.
More details about this must-know indicator can be found here: How to Discern a Major Market Top
Simon Maierhofer is the publisher of the Profit Radar Report. The Profit Radar Report presents complex market analysis (S&P 500, Dow Jones, gold, silver, euro and bonds) in an easy format. Technical analysis, sentiment indicators, seasonal patterns and common sense are all wrapped up into two or more easy-to-read weekly updates. All Profit Radar Report recommendations resulted in a 59.51% net gain in 2013.
Follow Simon on Twitter @ iSPYETF or sign up for the FREE iSPYETF Newsletter to get actionable ETF trade ideas delivered for free.

|
