Commodities have become a focal point, usually as scapegoat or precursor of bad things to come.
Most major commodities (including oil, gold, silver, copper, lumber and grains) have collapsed.
Many believe this is reflective of a weakening economy. I won’t enter this debate, but rather offer a look at a long-term, broad commodity chart.
Shown below is the CRB Reuters/Jefferies Commodity Index.
This index consists of 19 commodities: aluminum, cocoa, coffee, copper, corn, cotton, crude oil, gold, heating oil, lean hogs, live cattle, natural gas, nickel, orange juice, silver, soybeans, sugar, unleaded gas and wheat.
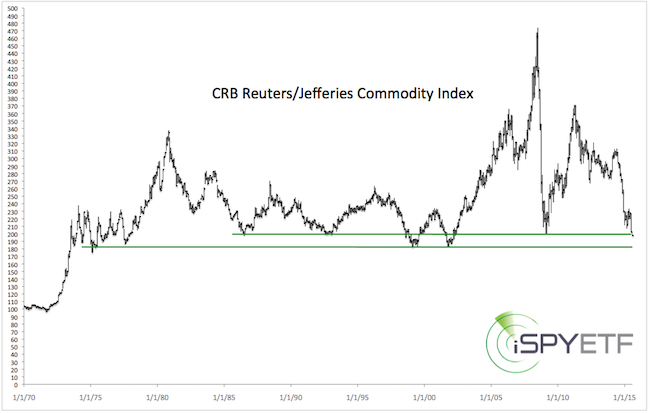
There are two main support areas. The index is threatening to break below the first one, and currently trading about 10% above the second one.
If you enjoy quality, hand-crafted research, >> Sign up for the FREE iSPYETF Newsletter
More down side is still possible and picking a buttom is like catching a falling knife, but the closer trade gets to support, the higher the odds of a bounce.
Although the corresponding ETF - the PowerShares DB Commodity Tracking ETF (NYSEArca: DBC) – hasn’t been around as long as the CRB Reuters/Jefferies Commodity Index, it too is nearing support.
A chart showing the surprising correlation between commodities and the S&P 500 is available here: Commodities vs S&P 500
Simon Maierhofer is the publisher of the Profit Radar Report. The Profit Radar Report presents complex market analysis (S&P 500, Dow Jones, gold, silver, euro and bonds) in an easy format. Technical analysis, sentiment indicators, seasonal patterns and common sense are all wrapped up into two or more easy-to-read weekly updates. All Profit Radar Report recommendations resulted in a 59.51% net gain in 2013 and 17.59% in 2014.
Follow Simon on Twitter @ iSPYETF or sign up for the FREE iSPYETF Newsletter to get actionable ETF trade ideas delivered for free.

If you enjoy quality, hand-crafted research, >> Sign up for the FREE iSPYETF Newsletter
|
