Bears must feel like Bill Murray in Groundhog Day as another V-shaped thrust suffocates hopes of a market crash. Stocks took the stairs down and the elevator back up.
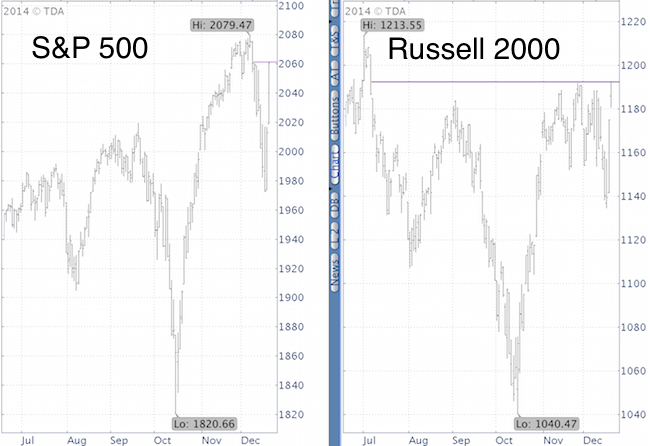
Two up days erased six days worth of S&P 500 losses for the S&P 500. That’s impressive, but not as impressive as this: It only took the Russell 2000 two days to soar to a 5 ½ month high.
Call Me Chicken
The December slump did not come unexpected, as the December 7 Profit Radar Report warned that: “The Dow Jones nearly tagged resistance at 18,004, increasing the chances of a temporary pullback. History suggests we may see a pullback before the next surge.”
The plan was to buy into weakness. The December 15 Profit Radar Report even reiterated that: “This week is ‘triple witching’ week. S&P 500 futures ended December triple witching week higher 31 of the last 32 years.”
But the market has a way of altering even the strongest convictions. Because the S&P 500 (NYSEArca: SPY) dipped below resistance, we only followed through on two buy orders - one of them was the iShares Small Cap ETF (NYSEArca: IWM) - and placed the rest on hold.
Yes, I kind of chickened out. But not buying is better selling or going short. A look at the latest NAAIM data of professional managers shows ‘the pros’ were selling at the low, again.
New Highs?
Stocks didn’t just rally. They rallied with an exclamation mark. Wednesday and Thursday were 90% up days, which means that 90% of volume and points are to the up side. Might as well call this a breadth thrust.
Aside from some back and filling action, history suggests further gains, which should translate into new highs. Once new highs are reached, the risk for a deeper correction increases (only a drop below this week's lows prior to new highs would unlock much lower targets).
Simon Maierhofer is the publisher of the Profit Radar Report. The Profit Radar Report presents complex market analysis (S&P 500, Dow Jones, gold, silver, euro and bonds) in an easy format. Technical analysis, sentiment indicators, seasonal patterns and common sense are all wrapped up into two or more easy-to-read weekly updates. All Profit Radar Report recommendations resulted in a 59.51% net gain in 2013.
Follow Simon on Twitter @ iSPYETF to get actionable ETF trade ideas delivered for free.

|
