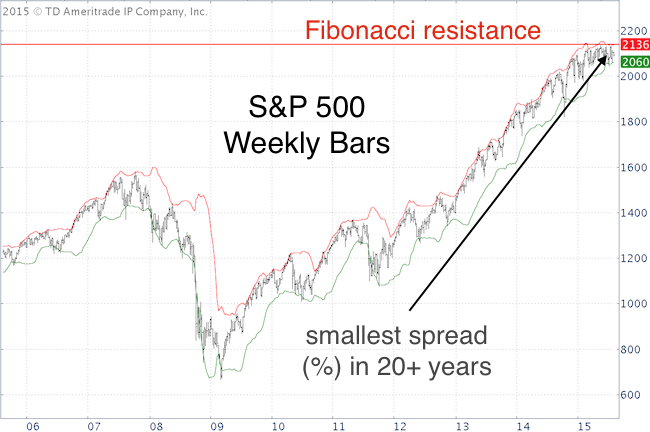
The spread between the upper and lower Bollinger Band on the weekly S&P 500 chart is currently only 3.56%, the smallest margin in over 20 years.
According to John Bollinger, such a ‘Bollinger Band Squeeze’ increases the odds of a substantial move (up or down).
A break above the upper Bollinger Band is said to lead to further gains, a drop below the lower Bollinger Band to further losses.
I’m no Bollinger Band compression specialist, but find it interesting that the upper Bollinger Band currently coincides with important Fibonacci resistance.
The Profit Radar Report’s S&P 500 Forecast for 2015 highlighted this Fibonacci resistance at the beginning of the year, and stated that: “Q1 correction lows should be followed by a rally to new all-time highs, with an initial target of 2,139.”
If you enjoy quality, hand-crafted research, >> Sign up for the FREE iSPYETF Newsletter
The S&P challenged 2,135 four times since April, and pulled back every time.
The lower Bollinger Band is near the 50-week SMA, which has been support since 2012 (more details here: Long-term S&P 500 Analysis) and technical support near 2,040.
2,140 and 2,040 have been like ‘handrails’ for the S&P 500, Bollinger compression suggests that the S&P will either stumble or roam freely once the handrails come off.
However, based on all my indicators, I wouldn’t be surprised if the S&P will relapse after a break above 2,140 or resurge after a break below 2,040.
Compression might be followed by range expansion.
Simon Maierhofer is the publisher of the Profit Radar Report. The Profit Radar Report presents complex market analysis (S&P 500, Dow Jones, gold, silver, euro and bonds) in an easy format. Technical analysis, sentiment indicators, seasonal patterns and common sense are all wrapped up into two or more easy-to-read weekly updates. All Profit Radar Report recommendations resulted in a 59.51% net gain in 2013 and 17.59% in 2014.
Follow Simon on Twitter @ iSPYETF or sign up for the FREE iSPYETF Newsletter to get actionable ETF trade ideas delivered for free.

If you enjoy quality, hand-crafted research, >> Sign up for the FREE iSPYETF Newsletter
|
