Crude oil prices tumbled 60% since last June, but oil rallied 5% or more each of the last three days and closed 20% above last week’s low.
Is oil getting ready to climb higher?
The pieces are in place for a tradable rally.
What pieces?
-
Trade bounced from long-term support
-
Short-term technicals show a bullish divergence
-
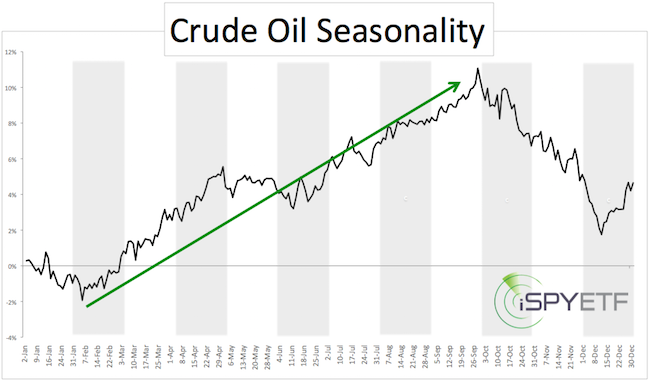
Oil seasonality is turning bullish
Long-term Support
The long-term crude oil futures chart shows strong support around 46. Trade tried to wear down support, but ultimately it held.
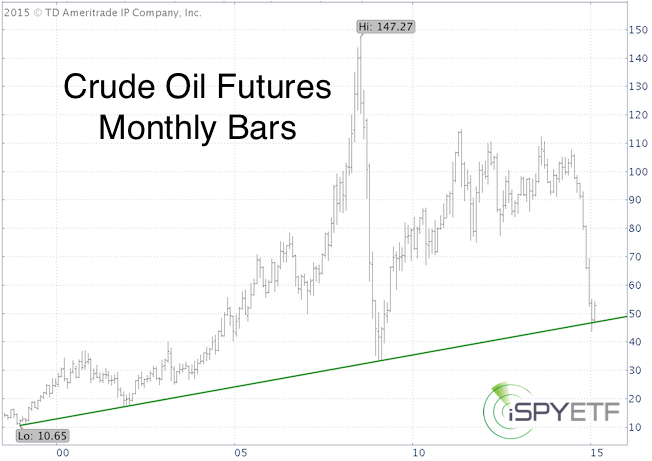
On January 28, we looked at the broader Reuters/Jefferies CRB Commodity Index (Key Commodity Index at Major Inflection Point May Provide Clues for Oil).
This index was also at key support, which provided a stop-loss for Oil ETFs like the United States Oil ETF (NYSEArca: USO) and iPath Oil ETN (NYSEArca: OIL).
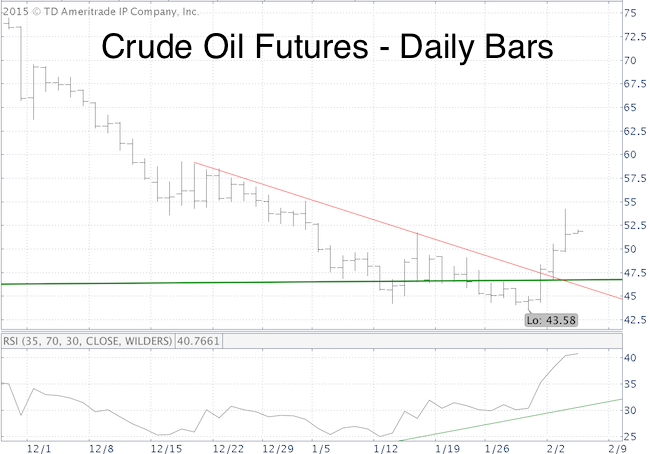
Bullish RSI Divergence
In late January, I was looking for new oil lows with a bullish RSI divergence and stated via the January 25 Profit Radar Report that: “Crude oil futures are now nearing those new lows. RSI is holding up well, setting up another potential inflection point for oil to rally. Seasonality is turning bullish in early February.”
The February 2 Profit Radar Report featured this chart, which shows:
-
A new low with a bullish RSI divergence
-
A break above red trend line resistance
Seasonality
Oil seasonality is turning bullish in February. My seasonality chart is based on 31 years of historical oil price patterns. This seasonal trend is too pronounced to ignore.
Summary
Oil is long-term oversold and short-term overbought. This may cause some short-term wiggles, but based on seasonality oil prices should climb higher.
Next resistance is around 55. A move above 55 should lead to further gains.
Simon Maierhofer is the publisher of the Profit Radar Report. The Profit Radar Report presents complex market analysis (S&P 500, Dow Jones, gold, silver, euro and bonds) in an easy format. Technical analysis, sentiment indicators, seasonal patterns and common sense are all wrapped up into two or more easy-to-read weekly updates. All Profit Radar Report recommendations resulted in a 59.51% net gain in 2013 and 17.59% in 2014.
Follow Simon on Twitter @ iSPYETF or sign up for the FREE iSPYETF Newsletter to get actionable ETF trade ideas delivered for free.

|
