Updated chart and analysis posted at the end of article!
The August 24 Profit Radar Report published this Dow Jones chart and stated that: “The Dow Jones sports a possible wedge formation with resistance starting at 17,250 next week (17,400 by the end of September).”
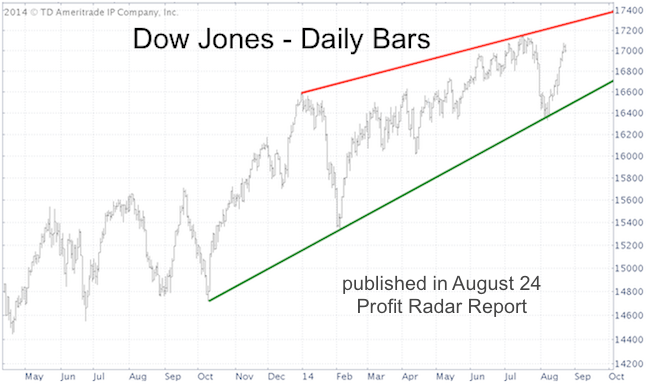
This red line has been our up side target ever since.
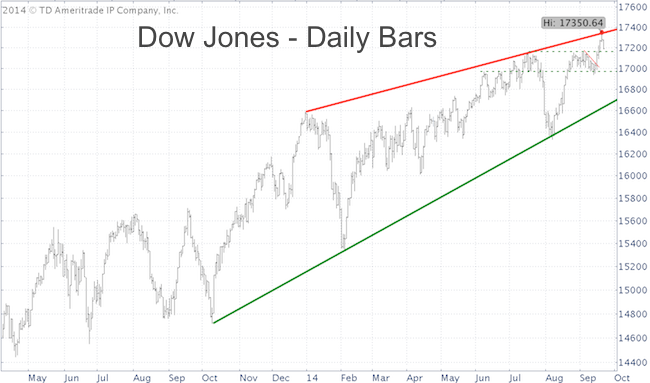
On Friday the Dow reached its target and pulled back as quickly as a hand accidentally touching a hot stove.
What makes a wedge a wedge?
Although prices rise within the rising wedge formation, market breadth is gradually petering out, as the advance is progressively growing weaker.
Don't Miss Any More Buy/Sell Signals - Sign Up for iSPYETF's FREE NEWSLETTER
That’s what we saw on Friday. Even though the Dow ended 0.08% higher, 60% of stocks traded on the NYSE declined. This rare breadth/price divergence occurred only 7 other times since this QE bull market started in 2009.
What are the implications of a wedge breakdown?
The Dow already touched the upper wedge side (red line). Once prices break out of the wedge down side (solid green line) they usually waste little time before declining and retracing all of the ground gained within the wedge itself.
So, a drop below the solid green line (currently around Dow 16,700) could unlock a target around Dow 15,000.
But let’s not get ahead of ourselves. The stock market has steamrolled over many bearish setups before and may do so again. The pattern could also get more complicated as was the case with the LQD Corporate Bond ETF earlier in April.
If you want to take baby steps, trade below 17,160 and 16,900 (dashed green support areas) would be initial confirmation of further down side.
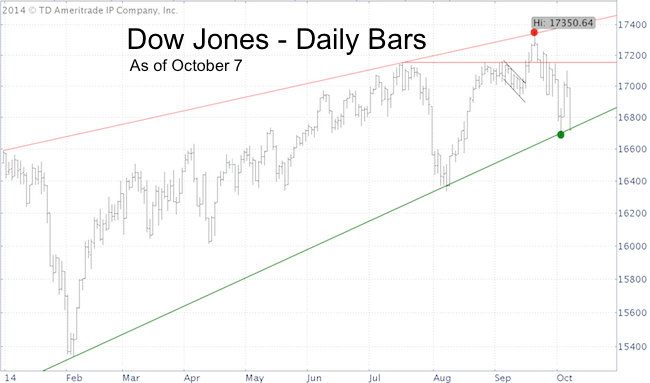
UPDATE (10-7-2014)
The Dow Jones touched wedge support twice. A breakdown could unlock significant down side. However, risk management is needed as we are seeing some oversold readings, which have led to bounces in the past.
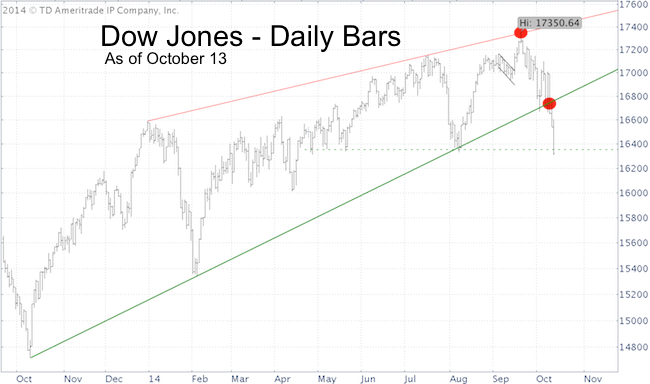
UPDATE (10-13-2014)
The Dow Jones broke below wedge support and accelerated to the down side. The October 1 Profit Radar Report warned that: "Today's decline endorsed the notion of a strong correction. Picking bottoms during such corrections is a fool's errand."
Simon Maierhofer is the publisher of the Profit Radar Report. The Profit Radar Report presents complex market analysis (S&P 500, Dow Jones, gold, silver, euro and bonds) in an easy format. Technical analysis, sentiment indicators, seasonal patterns and common sense are all wrapped up into two or more easy-to-read weekly updates. All Profit Radar Report recommendations resulted in a 59.51% net gain in 2013.
Follow Simon on Twitter @ iSPYETF or sign up for the FREE iSPYETF Newsletter to get actionable ETF trade ideas delivered for free.

|
