Once a month, the Profit Radar Report publishes a detailed analysis of investor sentiment (called Sentiment Picture).
The October 2015 Sentiment Picture tackled the question whether current investor sentiment is indicative of a major market top.
To find out, the Sentiment Picture provided a side-by-side comparison of investor sentiment at and leading up to the 2007 top with current sentiment.
Before we get to the 2007/2015 comparison, allow me to fine tune expectations. There are things sentiment analysis can and cannot do.
Sentiment analysis (like any single indicator) is not infallible and shouldn’t be used as stand alone indicator. The Profit Radar Report always looks at the combined message of supply/demand, technical analysis, seasonality and sentiment.
Sentiment, however can help gauge the probability of a major top or bottom. To illustrate, the July 24 Sentiment Picture attempted to answer the same question: Are there enough bulls to form a major market top?
It stated that: “Considering that stocks just were near all-time highs, sentiment is quite subdued. The lack of real investor enthusiasm, has continually pointed to new highs, and does so again this month. The question is when a bigger correction will occur.”
If you enjoy quality, hand-crafted research, >> Sign up for the FREE iSPYETF Newsletter
The ‘bigger correction’ started shortly thereafter, but stocks are trading near their 2015 highs once again.
The September 24 Sentiment Picture noted extreme bearishness and proposed that: “Sentiment is pointing towards a buying opportunity. In fact, purely based on overall sentiment, stocks should be closing in on a tradable low.”
That tradable low occurred three days later at S&P 1,871.
Are There Enough Bulls for a Major Market Top?
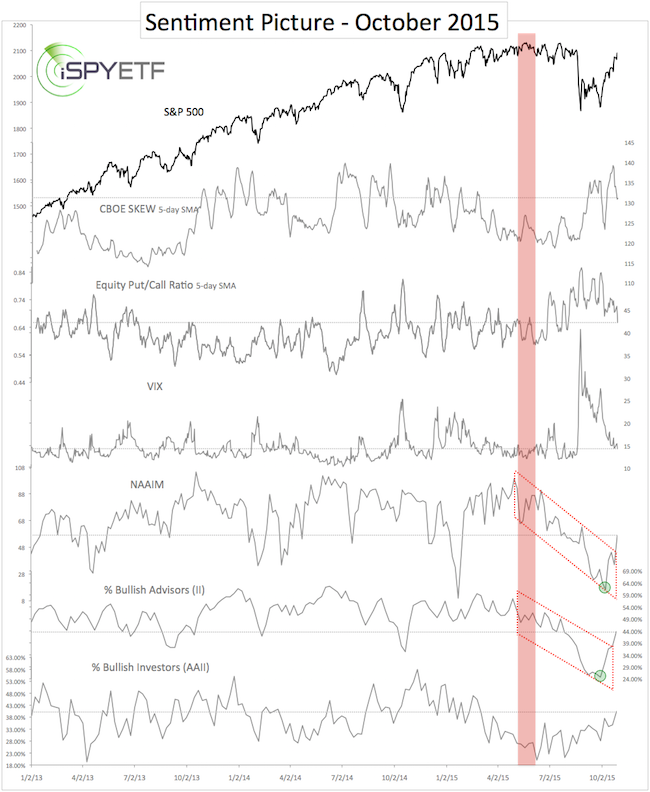
Below is the sentiment chart featured in the October 29, 2015 Sentiment Picture. This chart plots the S&P 500 against six different sentiment gauges (the actual sentiment analysis includes dozens more indicators):
-
CBOE SKEW Index
-
CBOE Equity Put/Call Ratio
-
CBOE VIX
-
National Association of Active Money Managers (NAAIM) equity exposure
-
Percentage of bullish advisors polled by Investors Intelligence (II)
-
Percentage of bullish retail investors polled by the American Association for Individual Investors (AAII)
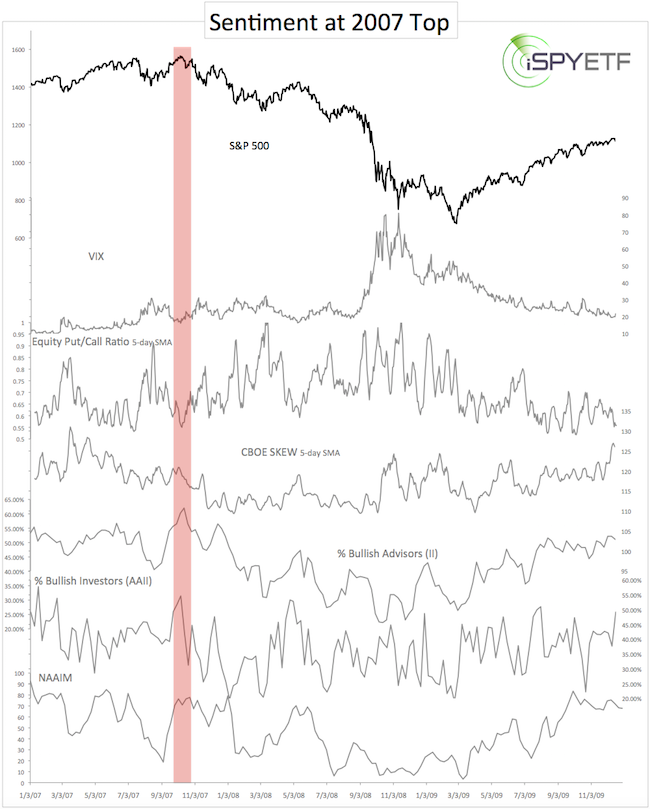
The second chart highlights investor sentiment surrounding the 2007 high.
-
In 2007, the VIX was trading near 16. This was 50% lower than the August high (near 30), but 60% above the 2007 low (near 10).
-
The CBOE Equity Put/Call Ratio (5-day SMA) was towards the lower end of its range.
-
The SKEW wasn’t extremely high, but towards the upper end of its range.
-
Investment advisors and newsletter writers (polled by Investors Intelligence – II) were extremely bullish.
-
Retail investors (polled by the American Association for Individual Investors – AAII) were extremely bullish.
-
Active investment managers (polled by the National Association of Active Investment Managers – NAAIM) were bullish.
In October 2015, investors are not as bullish as they were in 2007. This becomes particularly obvious when looking at the AAII, II and NAAIM crowd.
Since the October sentiment picture was published, investors have become a bit more bullish. Perhaps even bullish enough for another pullback (there was also some significant internal weakness last week), but investor enthusiasm is not as pronounced as it was in 2007 or other historic market tops.
Investor sentiment is just one of the four powerful price movers monitored by the Profit Radar Report. Here is a (free) detailed look at supply and demand (or liquidity): Is the Stock Market Running out of Willing Buyers?
Simon Maierhofer is the publisher of the Profit Radar Report. The Profit Radar Report presents complex market analysis (S&P 500, Dow Jones, gold, silver, euro and bonds) in an easy format. Technical analysis, sentiment indicators, seasonal patterns and common sense are all wrapped up into two or more easy-to-read weekly updates. All Profit Radar Report recommendations resulted in a 59.51% net gain in 2013 and 17.59% in 2014.
Follow Simon on Twitter @ iSPYETF or sign up for the FREE iSPYETF Newsletter to get actionable ETF trade ideas delivered for free.
If you enjoy quality, hand-crafted research, >> Sign up for the FREE iSPYETF Newsletter
|
