The VIX soared 43% on Monday, collapsed 19% on Tuesday and is up nearly 30% today. Just before that, the VIX fell to the lowest reading since February 2007.
Although the CBOE Volatility Index (VIX) is rushing from one extreme to the next, options traders as a whole have been remarkably ‘non-committal’ or lukewarm from a sentiment point of view.
This sentiment deviation is illustrated by the chart below. The CBOE Equity Put/Call Ratio has been narrowing in a triangle shape formation void of extremes. The 2010, 2011 and 2012 market highs were preceded by at least one daily reading below 0.5 and a drop of the 10-day SMA below or at least close to 0.55.
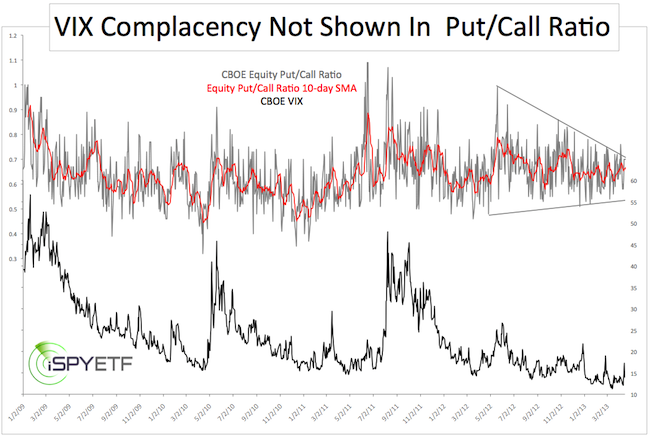
The 2013 Equity Put/Call Ratio low was at 0.54 on March 6 (the 10-SMA has yet to fall below 0.6). The recent all-time highs caused no put/call sentiment extremes.
Quite to the contrary, the VIX has rushed from one extreme to the next. For that reason, the Profit Radar Report noted back in November that the: “VIX has been of no use as a contrarian indicator and will be put on ‘probation’ until it proves its worth again.” Yes, the VIX is still on probation.
A SKEWed Market?
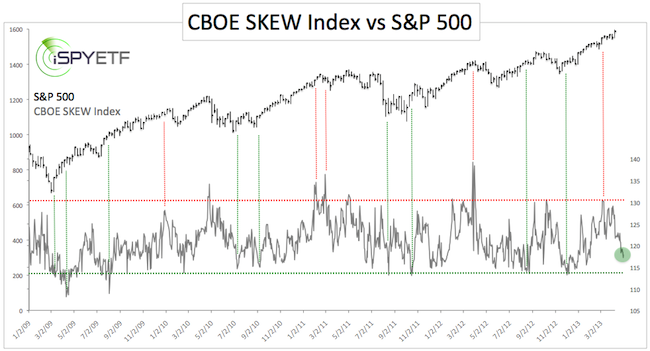
The CBOE publishes another options-based index like the VIX, it’s called the CBOE SKEW Index. The SKEW in essence estimates the probability of a large decline.
Readings of 135+ suggest a 12% chance of a large decline (two standard deviations). A reading of 115 or less suggests a 6% chance of a large decline. In short, the higher the SKEW, the greater the risk for stocks.
The chart below juxtaposes the SKEW against the S&P 500. Last week the SKEW fell as low as 117. This was odd as readings below 115 (dashed green line) are generally bullish for stocks.
Conclusion
The CBOE Equity Put/Call Ratio and SKEW index proved to be valuable contrarian indicators in 2010, 2011 and 2012. The current option-trader sentiment is not bullish, but it’s not as bearish as one would expect to see at a major market top.
To an extent, option-trader sentiment is in conflict with other bearish sentiment extremes discussed recently. When sentiment indicators conflict, technical analysis and support/resistance levels become even more valuable.
The April 10, Profit Radar Report highlighted key resistance at 1,593 and stated that: “A move above 1,593 followed by a move back below 1,590 will be a sell (as in go short) signal.”
As long as prices remain below key resistance, the trend is down until stocks find key support.
|
