It’s been a while since the last free crude oil analysis (March 23: Next? A Crude Awakening for Oil Bears?).
The March 23 article noted that: “Commercial traders are starting to prepare themselves for further gains. Oil seasonality also suggests higher prices. Probably more important is a trend line that’s been important for oil prices for nearly two decades (this proprietary trend line and detailed oil seasonality chart reserved for subscribers of the Profit Radar Report). A move above this trend line is likely to trigger a rally.”
This important trend line is now in the rear view mirror, and I’m able to disclose it without conflict to my paying subscribers.
The green bold line in the crude oil futures chart below represents this trend line. It originates all the way back in 1998.
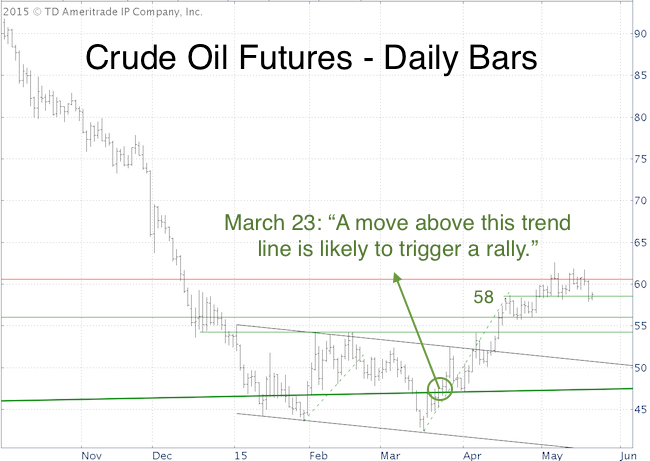
Since overcoming the bold green trend line, oil prices rallied as much as 33%.
Below is a summary of observations made in the Profit Radar Report since March:
March 29: “For aggressive traders, playing the long side (buy on dips) should ultimately prove profitable.”
April 8: “A close above 54.30 should bring more follow through gains.”
Never Miss a Beat! >> Sign up for the FREE iSPYETF e-Newsletter
April 15: “Crude oil broke above 54 today. The breakout has legs as long as it stays above 54.”
May 6: “Oil prices are now gnawing on the resistance zone around 60. Yesterday’s red candle high may cause a pause. Next support is around 58.50, which could be an opportunity to buy.”
Oil is trading around 58.50 right now. Based on seasonality, price may test support at 56 or 54.30 between now and mid-June (proprietary oil seasonality chart available to Profit Radar Report subscribers).
Overall, I anticipate oil prices to move higher as long as support at 54.30 holds.
Based on seasonality, buying oil ETFs like the United States Oil Fund (NYSEArca: USO) or iPath Crude Oil ETN (NYSEArca: OIL) before mid-June and/or around 54 – 56 (based on crude oil prices) is a trade worth watching.
Simon Maierhofer is the publisher of the Profit Radar Report. The Profit Radar Report presents complex market analysis (S&P 500, Dow Jones, gold, silver, euro and bonds) in an easy format. Technical analysis, sentiment indicators, seasonal patterns and common sense are all wrapped up into two or more easy-to-read weekly updates. All Profit Radar Report recommendations resulted in a 59.51% net gain in 2013 and 17.59% in 2014.
Follow Simon on Twitter @ iSPYETF or sign up for the FREE iSPYETF Newsletter to get actionable ETF trade ideas delivered for free.

Never Miss a Beat! >> Sign up for the FREE iSPYETF e-Newsletter
|
