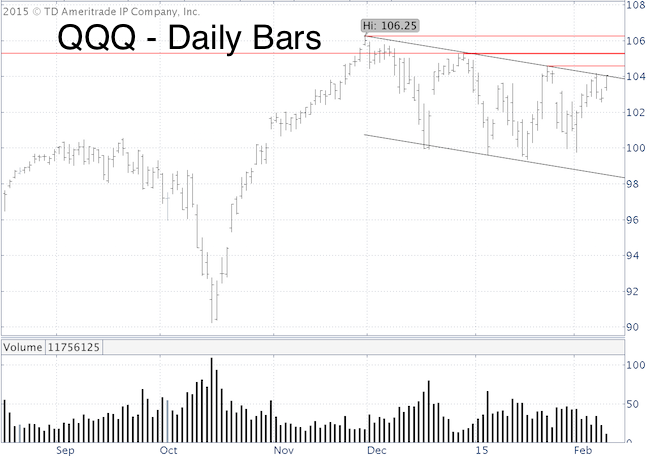
The Nasdaq QQQ ETF (Nasdaq: QQQ) chart is simple, but packed with information.
QQQ has been consolidating for 2 ½ months. The consolidation range is defined by a parallel channel with a slant to the down side.
Channel resistance is at 104. Resistance created by the January 23 and November 29 highs is at 104.58 and 105.25.
There’s also a Fibonacci projection level, going back to the October 2002 low, at 105.29.
I’ve read some articles that describe the channel consolidation as a bull flag.
What is a bull flag?
As the name implies, this pattern looks like a flag. A bull flag represents a digestive period after a sharp rise.
In a bull market, the flag is usually formed with a slight down trend and tends to separate two halves of a steep rally.
If this is indeed a bull flag, a breakout above 104 projects a target around 120.
Stay in the loop, sign up for the FREE iSPYETF Newsletter
Is this a bull flag?
-
Duration: In their technical analysis books, authors Pring, Edwards and Magee state that flags can form for a period as short as 5 days or as long as 3 – 5 weeks. But a formation that lasts longer than 4 weeks should be treated with caution.
This particular flag pattern is already 10 weeks old.
-
Trading volume: Trading volume should diminish appreciably and constantly during the pattern’s construction and continue to decline until prices break away from it.
Trading activity dried up in February, but saw significant volume spikes early in the pattern.
In summary, the 10-week long QQQ consolidation pattern looks like a bull flag, but it does not meet the qualifications of a bull flag.
Nevertheless, certain measures of sentiment show above average pessimism for the Nasdaq QQQ ETF, which could support further up side.
Here is a bit more context: The SPDR S&P 500 ETF (NYSEArca: SPY) is gnawing on similar resistance, and the SPDR S&P MidCap 400 ETF (NYSEArca: MDY) just broke to new all-time highs. The 104 – 106.25 QQQ range appears pretty significant for the next big move.
I’ve taken a pretty bold stand regarding the next S&P 500 move, and am watching the QQQ ETF carefully for clues.
My bold S&P 500 call is available here with the latest update posted here.
Simon Maierhofer is the publisher of the Profit Radar Report. The Profit Radar Report presents complex market analysis (S&P 500, Dow Jones, gold, silver, euro and bonds) in an easy format. Technical analysis, sentiment indicators, seasonal patterns and common sense are all wrapped up into two or more easy-to-read weekly updates. All Profit Radar Report recommendations resulted in a 59.51% net gain in 2013 and 17.59% in 2014.
Follow Simon on Twitter @ iSPYETF or sign up for the FREE iSPYETF Newsletter to get actionable ETF trade ideas delivered for free.

|
