All for one and one for all may have worked for the Three Musketeers, but it’s not working for the Dow Jones Averages.
All three Dow Jones Averages are pulling in different directions.
The Dow Jones Industrial is near its all-time high. The Dow Jones Utility just came off a nine-month low and the Dow Jones Transportation Average has been stuck in neutral for four months.
Here’s a look at all three averages and an attempt to interpret the meaning of the broad Dow Jones disharmony.
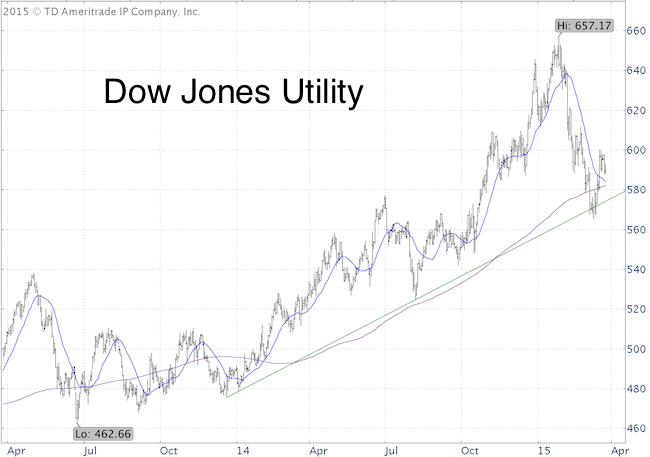
Dow Jones Utility Average (DJU)
The Dow Jones Utility Average (DJU) lost as much as 14% from January 28 to March 11.
On March 11, the Profit Radar Report noted that: “Utility stocks are down 13% from their recent high, and every stock component of the Utility Select Sector SPDR ETF (NYSEArca: XLU) is trading below its 50-day SMA. RSI is at a level that sparked rallies in June 2013 and August 2014. XLU trend line resistance is just below today’s close. Unlike XLU, the Dow Jones Utility Average already close below its trend line. Nevertheless, utility stocks are compressed and should soon spring higher.”
Never Miss a Beat! >> Sign up for the FREE iSPYETF e-Newsletter
The latest rally started on March 12, and as long as support at 585 – 574 holds, DJU may continue higher.
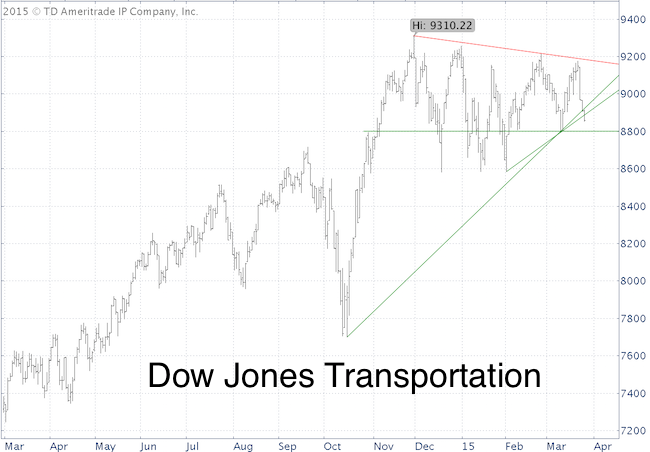
Dow Jones Transportation Average (DJT)
The Dow Jones Transportation Average (DJT) has been stuck in a multi-month triangle, and is threatening to close below triangle support.
A break down below the ascending green trend lines has to be graded bearish (unless it reverses). Next support is at 8,800 and 8,600.
The iShares Transportation Average ETF (NYSEArca: IYT) tracks the DJT.
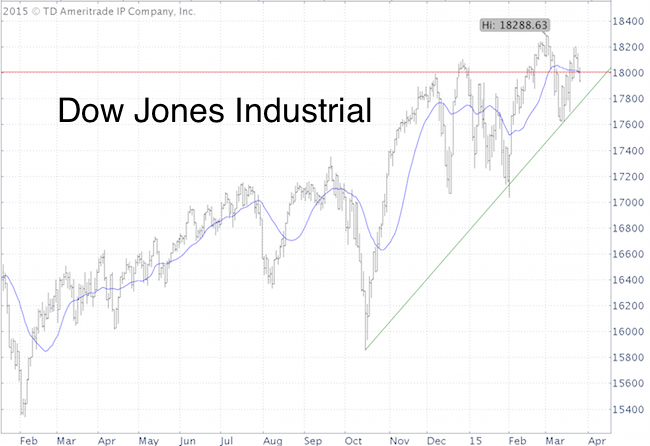
Dow Jones Industrial Average (DJI)
The Dow Jones Industrial Average (DJI) just fell below long-term Fibonacci support/resistance at 18,004, which is also where the 20-day SMA is.
This allows for continued weakness.
The SPDR Dow Jones Industrial Average ETF (NYSEArca: DIA) tracks the DJI.
Bearish Divergences?
The lack of confirmation among the Dow Average isn’t a bullish development, but thus far the key U.S. indexes are not displaying signs of a major market top (for more details about the indicator that’s identified the 1987, 2000 and 2007 tops go here: Is the S&P 500 Carving Out a Major Market Top?).
Until we get the same kind of deterioration seen at prior bull market highs, divergences among the Dow Average may just be a distraction.
Simon Maierhofer is the publisher of the Profit Radar Report. The Profit Radar Report presents complex market analysis (S&P 500, Dow Jones, gold, silver, euro and bonds) in an easy format. Technical analysis, sentiment indicators, seasonal patterns and common sense are all wrapped up into two or more easy-to-read weekly updates. All Profit Radar Report recommendations resulted in a 59.51% net gain in 2013 and 17.59% in 2014.
Follow Simon on Twitter @ iSPYETF or sign up for the FREE iSPYETF Newsletter to get actionable ETF trade ideas delivered for free.

|
